


MSA Safety Inc. (MSA)
There's a lot to like!
")
Before we dive into MSA Safety, here are some recently covered stock you may be interested in:
Background
MSA Safety MSA 0.00%↑ is a global leader in developing, manufacturing, and supplying safety products as well as software solutions for worker and facility protection.
MSA is headquartered in Cranberry Township, PA and was founded in 1914 after a mining accident highlighted the need for better safety equipment.
MSA 0.00%↑ has total return over the past decade of nearly 300% resulting in a CAGR of 14.7%, which slightly outpaces the S&P 500 as measured by SPY 0.00%↑, which has a CAGR over the past ten years of 13.33%.

Source: FinChat.io Quality Financial Metrics
Let’s examine MSA Safety’s financials and determine how the company has performed.
Revenue Per Share:
The revenue per share has grown from $30.3 per share in FY15 to almost $46.00 last year.
There’s been some rough periods for this metric, but in recent years the RPS has begun to climb, including an almost 17% increase in FY23.
Gross Profit Margin:
The gross profit margin has remained relatively stable over the last 10 years, fluctuating between 43.9% and 47.7%.
The stability of this metric is a testament to the company’s profitability and effective cost management.
The recent GPM improvement could be the result of investments in IoT and connected technologies (i.e. Safety io Grid), which is a cloud-based remote monitoring and smart compliance management solution designed for managing fleets of portable gas detectors.
Return on Invested Capital:
The ROIC for MSA has more than doubled in the past ten years from 7.7% to 17.2%, with some fluctuations along the way.
Despite the notable dip in 2023, the relatively steady ROIC indicates effective capital utilization and growth.


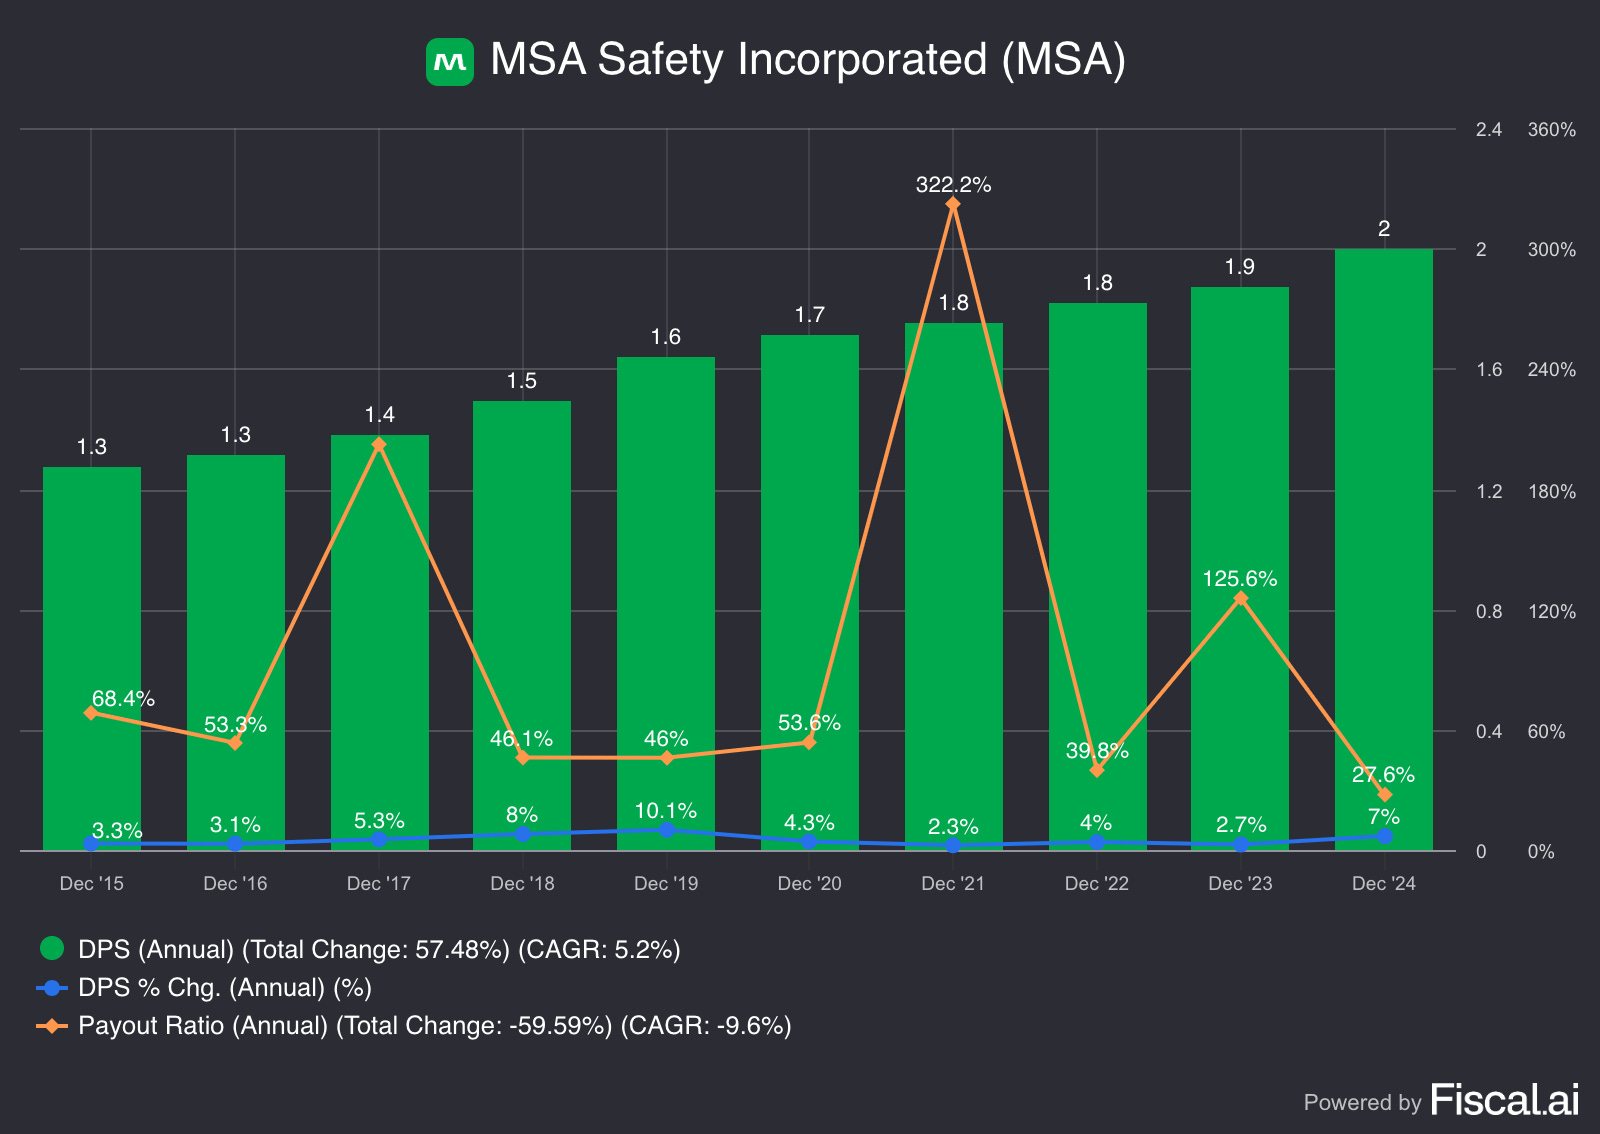
Dividend Data
MSA 0.00%↑ has raised their dividend for more than 50 years, making it a dividend champion.
The 10-year dividend growth rate is a respectable 5.2%, not bad for a company with such a long dividend history.
The payout ratio has oscillated higher some years, but is overall at a very safe level, including last year where it came in at just 27%.
Potential Headwinds
Industrial End Market Weakness: MSA Safety has faced challenges due to pockets of softness in the industrial end market, impacting sales growth. This was specifically mentioned in their fiscal year 2024 results, as well as their outlook for 2025.
Foreign Exchange Rate Headwinds: Fluctuations in currency values, particularly transactional revenues and margins (i.e. Latin American currencies), have been a drag on the company. This was also noted in their 2024 year-end reports, along with their Q1 2025 earnings release.
Q1 2025 Earnings
MSA 0.00%↑ has a great history of topping EPS estimates, doing so in 7 out of the last 8 quarters. On the revenue front, MSA has beaten revenue estimates in 5 out of the last 8 quarters.
In late April MSA 0.00%↑ announced their Q1 2025 earning with a double-beat, Non-GAAP EPS was $1.68 beating the consensus by $0.10, on revenue of $421M, which exceeded analyst expectations by $18M and was a 1.9% YoY increase.
Revenue for the Americas segment was $293.2M, down slightly compared to Q1 2024, where the company earned revenue of $295.5M. Operating Income declined 9% to $76.5M, while the operating margin shrank 240 bps to 26.1%.
Revenue for the International segment rose 9% to $128.2M, up from $117.8M for the same period a year ago. Additionally, operating income for the quarter was $17.3M a 56% YoY increase, while the operating margin expanded by 410 bps to 13.5%.
2025 Outlook: Management maintained low-single-digit full-year organic sales growth.
Also check out some tools to help with your investing journey
Follow on other social media platforms
Link to Youtube
Link to X @LongacresFin
Valuation
Let’s review our valuation chart for MSA 0.00%↑ and determine if the stock is trading for a discount right now.