


Moody's Corporation (MCO)
")
Moody’s Corporation MCO 0.00%↑ is a globally recognized business and financial services company, primarily know for its role in assessing and managing financial risk through its two arms; Moody’s Investor Service (MIS) and Moody’s Analytics (MA). The MIS segment of the business assigns credit ratings to debt securities issued by corporations, government and other entities, going from Aaa to C. Alternatively, MA is focused on non-rating services, offering software, data and analytical tools to assess risk management, economic research and credit analysis. The company was founded by John Moody in 1909 and is headquartered in New York, NY. Over the past decade MCO 0.00%↑ has an CAGR of nearly 20%, outpacing the S&P 500, as measured by SPY 0.00%↑, by about 6% annually.

Additionally, here are some of Moody’s current financial metrics:

Quality Metrics
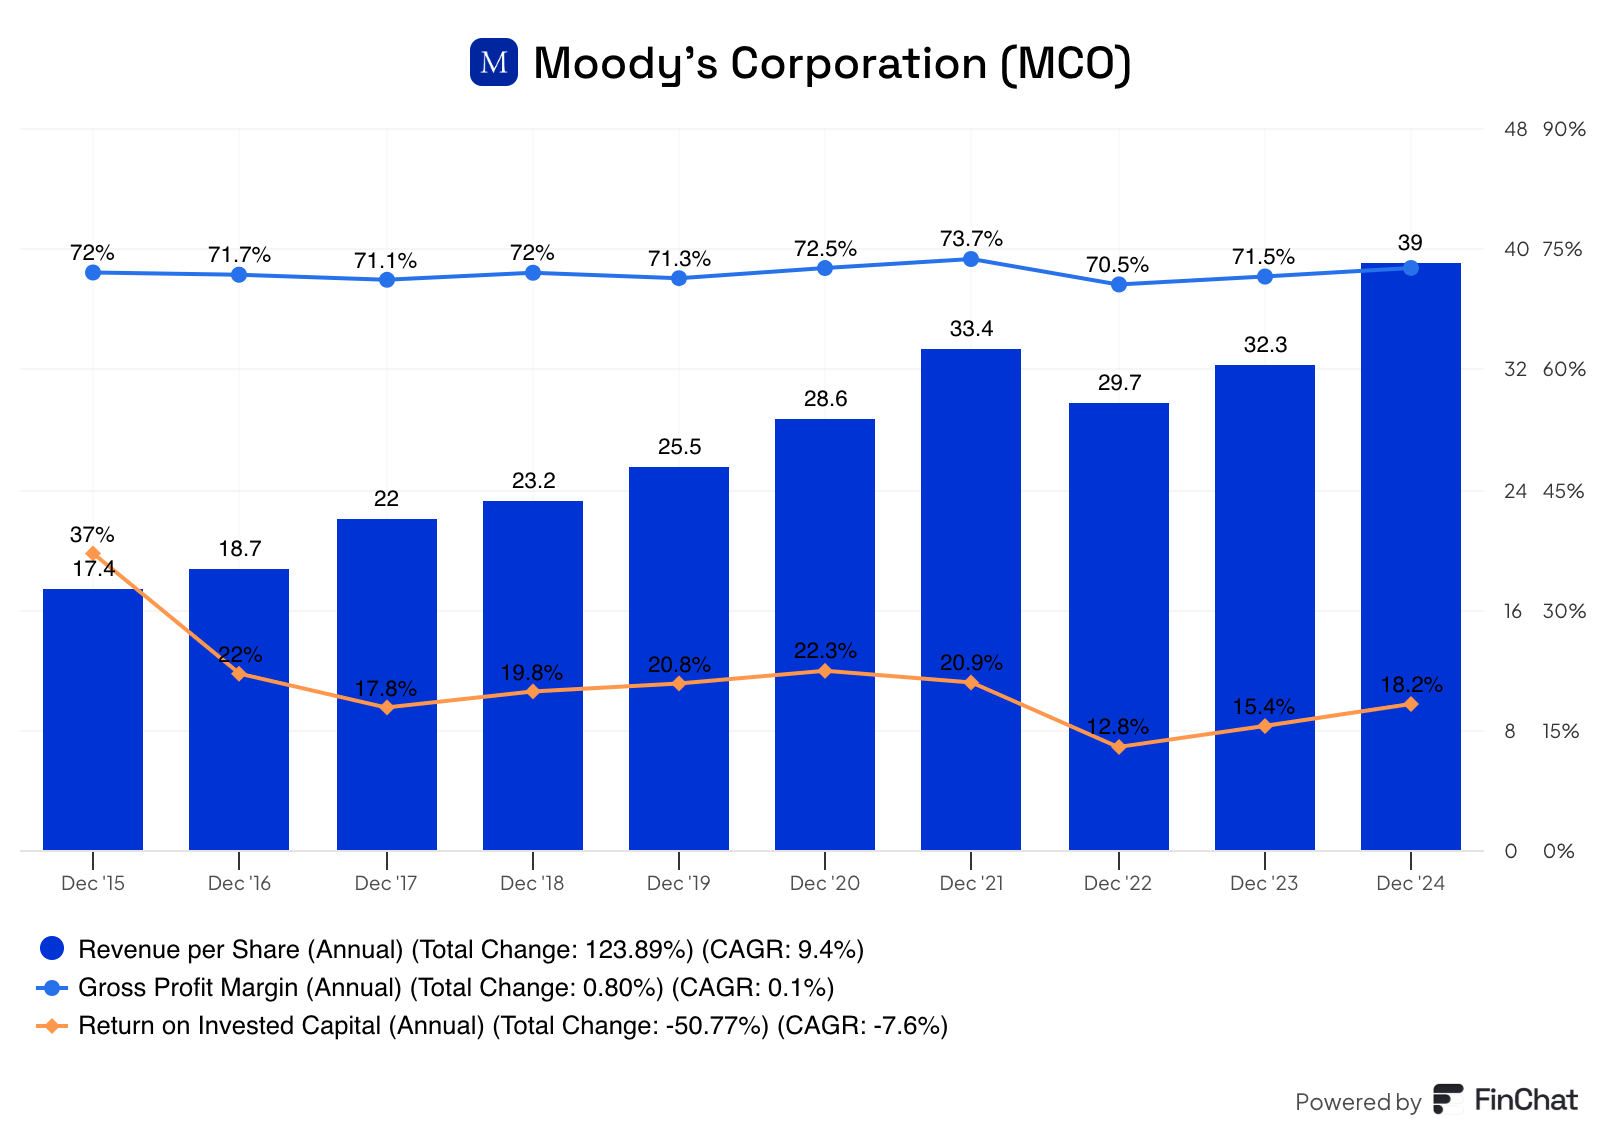
As is custom for this section I’ll be looking at Moody’s financial metrics to see how they are trending. The three areas I’ll be reviewing are the revenue, the gross profit margin and the return on invested capital.
The revenue per share for MCO 0.00%↑ was on a reliable upward trend until 2022 where it declined about 12%. The reason for the decline was due to reduced credit market activity across all sectors, along with consistent market volatility, heightened inflation, and recession concerns. Since the decline the RPS metric has recovered, with revenue growth of 8.6% in FY23 and more than 20% in FY24. It’s also worth mentioning the company does repurchase their shares regularly, typically between 0.5% and 1% per year, contributing a small percentage to the RPS growth.
The gross profit margin has been routinely above 70% over the past decade with minimal fluctuations. To be honest, there isn’t a lot to discuss here, a GPM of 70% is a remarkable achievement especially when done with such regularity.
Moody’s began the past decade with an extremely impressive 37% return on invested capital. Following that mark, it declined to a still very respectable 22% in FY 2016. Since then this metric has hovered around the 20% mark, fluctuating just below and above it for the next handful of years. Fiscal year 2022 the ROIC dipped to 12.8%, but recovered to 15.4% in 2023, and 18.2% just last year, similar to the revenue per share numbers.
All of these metrics are very impressive, consistent revenue growth, outside of a small decline in 2022. A stable and steady gross profit margin as well as a strong ROIC. With all that being said, I believe Moody’s is a high quality company with remarkable financials and should be considered by dividend investors.
Dividend Data
Moody’s has raised its dividend for 16 years making it a dividend contender, including a 10.59% increase already announced this year and payable in March. This increase was in-line with its 10-year dividend growth rate which sits slightly higher at 10.7%, while it’s 3 & 5-year DGR’s are even higher at 11.1% and 11.2%, respectively. MCO 0.00%↑ doesn’t offer a lot in the way of yield, with it currently sitting at about 0.75%, but as displayed above the dividend growth is where MCO 0.00%↑ shines. Lastly, the payout ratio is very low, in and around 30%, with FY 2016 as an obvious outlier, but as you should know, a low payout ratio leaves the company with an abundant amount of room for future dividend increases.

Potential Headwinds
Moody’s has a strong moat being the market leader in providing credit ratings on fixed income securities; however, the company is not without potential problems, typically surrounding the economy.
Economic downturns and reduced demand for ratings are a couple of the primary problems MCO 0.00%↑ could face. During recessions or periods of economic uncertainty, companies and municipalities may issue less debt, driving down the overall demand for credit ratings. An example of this would be a slowdown in corporate bonds being issued for infrastructure projects, this could shrink their MIS revenue streams, since their line of business closely follows the volume within debt markets.
Another potential headwind for MCO 0.00%↑ is their accuracy and reliability, especially following the 2008 financial crisis, where they were criticized for overly high ratings on mortgage-backed securities. Most companies probably learned their lesson following that debacle, but similar problems in the future could result in increased compliance costs and/or penalties for inaccurate information and hurt their overall reputation.
Public companies aren’t without risk but it’s important for them to mitigate the risk as best as possible, if they can. The first risk mentioned above is essentially out of their control, but the second one is something they hopefully don’t fall victim to again, but time will tell.
2024 Q4 & Full Year Earnings w/2025 Outlook
MCO 0.00%↑ announced Q4 2024 earnings a couple weeks ago, with a miss on top line revenue which came in at $1.7 billion, missing by $10 million, but was a 13.3% increase YoY. Adjusted earnings per share beat analyst expectations by $0.04 and were $2.62 for the quarter, a 20% increase from the same quarter a year ago, while GAAP EPS increased 17% to $2.17 a share.
Looking at the two segments of MCO 0.00%↑, Moody’s Analytics revenue rose 8% to $863M for the quarter, while Moody’s Investors Service was $809M for Q4, an increase nearly 20% from Q4 2023.
For FY24, total revenue rose 20% to $7.1 billion, with GAAP EPS rising 29% for the year to $11.26, and Non-GAAP EPS surging 26% to $12.47 per share. Again looking at the pieces of MCO 0.00%↑, Moody’s Analytics had FY24 revenue of $3.3B an 8% increase, from FY23, while Moody’s Investors Service was $3.8B for the year, an outstanding 33% increase YoY.
Management also provided guidance for 2025 and they project revenue growth in the high single digit percent range. GAAP EPS is expected to be between $12.75 and $13.25, with adjusted EPS between $14 and 14.50 per share. Finally, MCO 0.00%↑ anticipates free cash flow of $2.4 to $2.6 billion and foresees share repurchases of at least $1.3 billion.

Valuation
The final piece of this puzzle is to try and determine if MCO 0.00%↑ is trading for an attractive valuation at its current levels and we’ll look at it from a free cash flow perspective to do so.
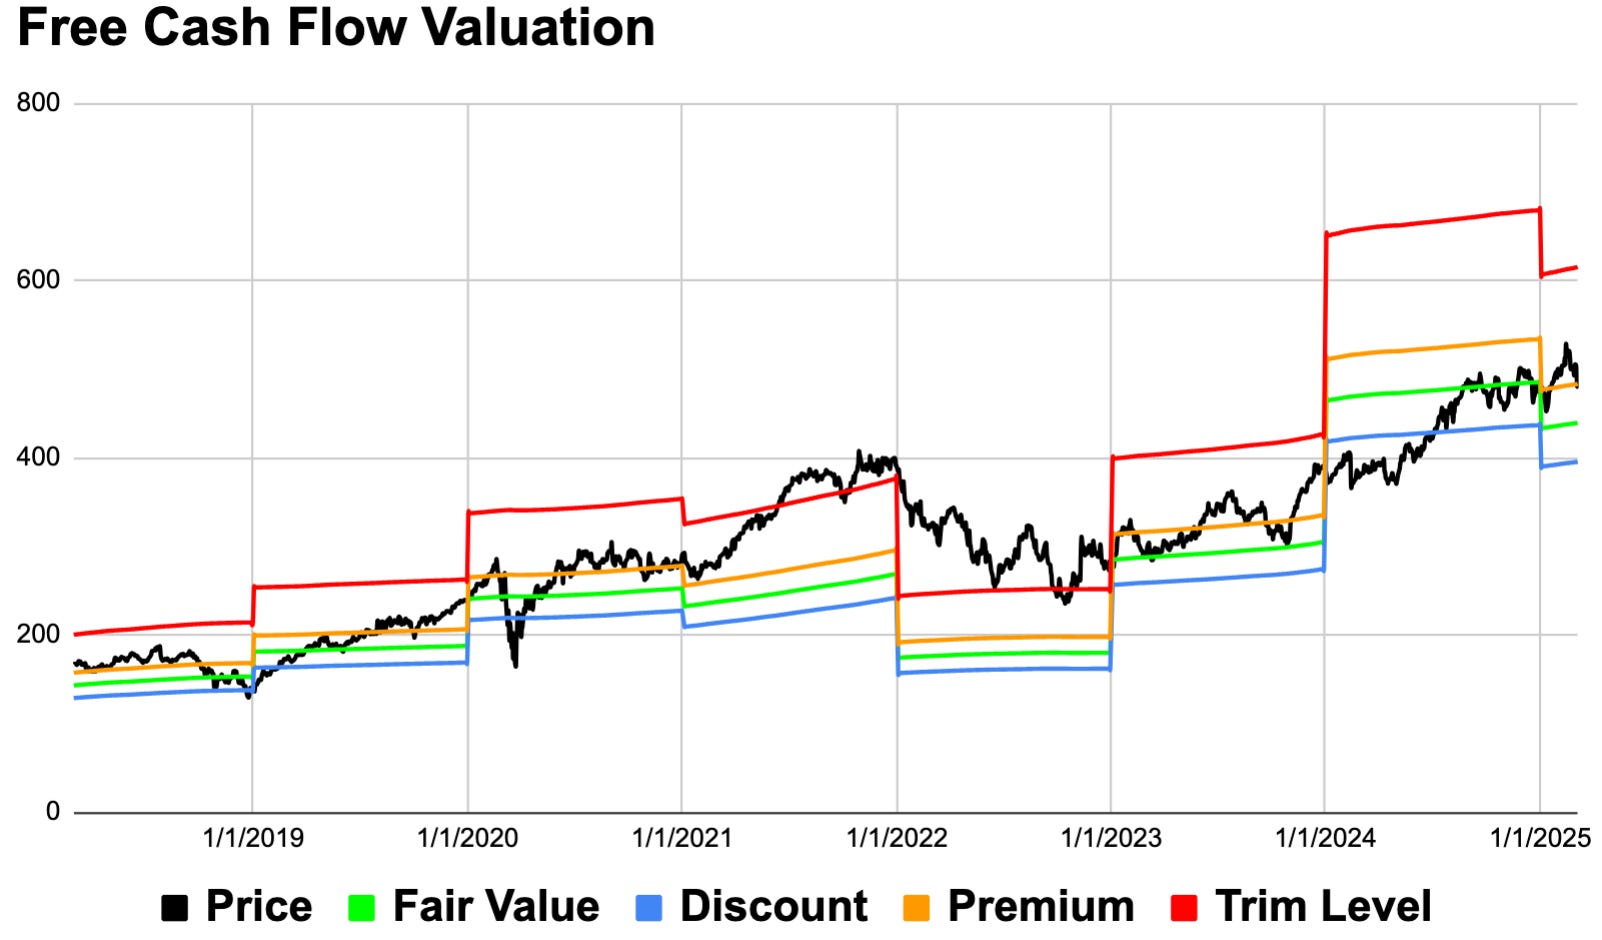
Examining MCO 0.00%↑ beginning in 2018 through most of 2019 the company’s stock price didn’t veer far from its fair value, even though it dipped a small amount in 2018 (about 4%) it rose quite a bit in 2019 (71%) and ended the year trading for a high premium. Aside from the covid drop early in 2020, the stock had another solid year posting a 23% gain and it continued to trade for a premium. FY21 the stock climbed another 35% and the company spent the 2nd half of the year above the trim line, indicating a clear overvaluation. The FCF declined by about 35% in FY22 and the stock price followed, retreating more than 28%. MCO 0.00%↑ has had FCF growth of 58% in FY23 and 52% in FY24, and the stock has climbed as well, 41% and 22%, respectively. Year-to-date the stock is up another 2% but the FCF model suggests the stock is trading for an approximate 10% premium.
The company has an expected RoR of 11.14% with the components of the estimate being a 0.78% dividend yield, a -1.92% return to fair value factor and an estimated 12.28% EPS growth rate.
To sum up, MCO 0.00%↑ is the leader in credit ratings of debt issuance, they have very strong financial metrics, as well as a rising dividend with a low payout ratio. There are potential risks they could face but it appears following their most recent earnings release the company is operating very well, with no obvious problems. Although the company appears to be overvalued by a modest amount, MCO 0.00%↑ doesn’t trade for a discount very often, so the recent pullback in the market could offer investors a good opportunity to initiate a position and potentially dollar cost average into this stock more, should the overall market continue to drop.
The long-term quality score for MCO 0.00%↑ is 90.5%, a very high rating, but what’s even more impressive is their 2024 score is even higher at 97.7%.
If you found this content insightful consider upgrading to a paid subscription, you can see live valuation ratings here, at any time. Additionally, you’ll gain access to a live complimentary Free Cash Flow Valuation Tool for over 200 stocks, as well as access to our 3 model portfolios. The paid subscription is only $5 per month and you can cancel any time.
In case missed them, here are some recently covered stocks
Allison Transmission Holdings ALSN 0.00%↑
HCA Healthcare Inc. HCA 0.00%↑
Texas Roadhouse Inc. TXRH 0.00%↑
Also check out some tools to help with your investing journey
Follow on other social media platforms
Link to Youtube
Link to X @LongacresFin