


Can You Retire Passively With VIG?

Earlier this month we analyzed the possibility of retiring with Vanguard’s High Dividend ETF VYM 0.00%↑. We stressed the ETF beyond its typical passive dividend stream to see if it could afford us a respectable retirement under various hypothetical scenarios and adverse market conditions. You can read the full analysis here. You can also listen to me speak about it in this video.
Many of you asked to see more of this analysis, and as promised I put Vanguard’s more popular dividend ETF, the Dividend Appreciation ETF VIG 0.00%↑ through the same ringer . But I decided to take the analysis one step further. In addition to the withdrawal rate stress test, that is now shown annually instead of quarterly (another subscriber request), I also built an accumulation test to see what type of outcome a passive investing strategy with only VIG 0.00%↑ would generate. A link to the interactive google spreadsheet will be provided down at the bottom for those of you that are interested in running your own scenarios.
Complimentary Subscription Giveaway
The first free subscriber that likes this post will receive a free 7 day complimentary subscription to Quality At A Fair Price!!
And if this post gets 10 likes in total (a new record for me) I will do another complimentary subscription giveaway in the next post!
A brief summary of VIG
Vanguard’s Dividend Appreciation ETF VIG 0.00%↑ is the largest dividend focused ETF on the market, in terms of Assets Under Management (AUM), just shy of $106B as of 2/22/25. The Funds stated objective is to track the performance of the S&P Dividend Growers Index. It does so through a passive investment style that affords it one of the lowest expense ratios in the market, just 0.05%. For perspective the category average expense ratio, as reported by Vanguard, is 0.77%, implying that VIG 0.00%↑ is 15.4 times cheaper than its peers. The Fund started actively trading on 04/21/2006 and has generated a respectable compound annual growth rate (CAGR) of 9.91% since inception.
The S&P Dividend Growers Index is primarily made up of large cap companies with a blend between Value and Growth, and a commitment to dividend growth. The Fund holds 337 unique positions and has a trailing twelve month dividend yield of 1.67%. While its dividend yield may not be very appealing, VIG 0.00%↑ has grown its dividend at a rate of 10.89% since inception. This pace of dividend growth has been slowly declining with the 2024 dividend increase being just 5.33%. However, the pace of dividend growth does oscillate from year to year, just recently, in 2021 and 2022 VIG 0.00%↑ paid very generous and higher dividends, with increases of 15.83% and 11.74% respectively.
If you’d like to look deeper into this Fund a good place to start is on Vanguard’s website, a link to VIG’s page is here.
Withdrawal Rate Test
I’ll put VIG 0.00%↑ through the same ringer of tests as VYM 0.00%↑, this way we can more easily see if one Fund is favorable over the other.
We’re going to assume we retired in December of 2006 with X dollars of capital and we decided to invest all of this money into VIG 0.00%↑. Would this dividend ETF be able to provide sufficient income to fund our retirement?
To keep this test simple I’m going to only change around 4 variables.
Starting Capital
Required Rate of Withdrawal
Inflation
Start Date of Test
Test 1: The 4% Rule
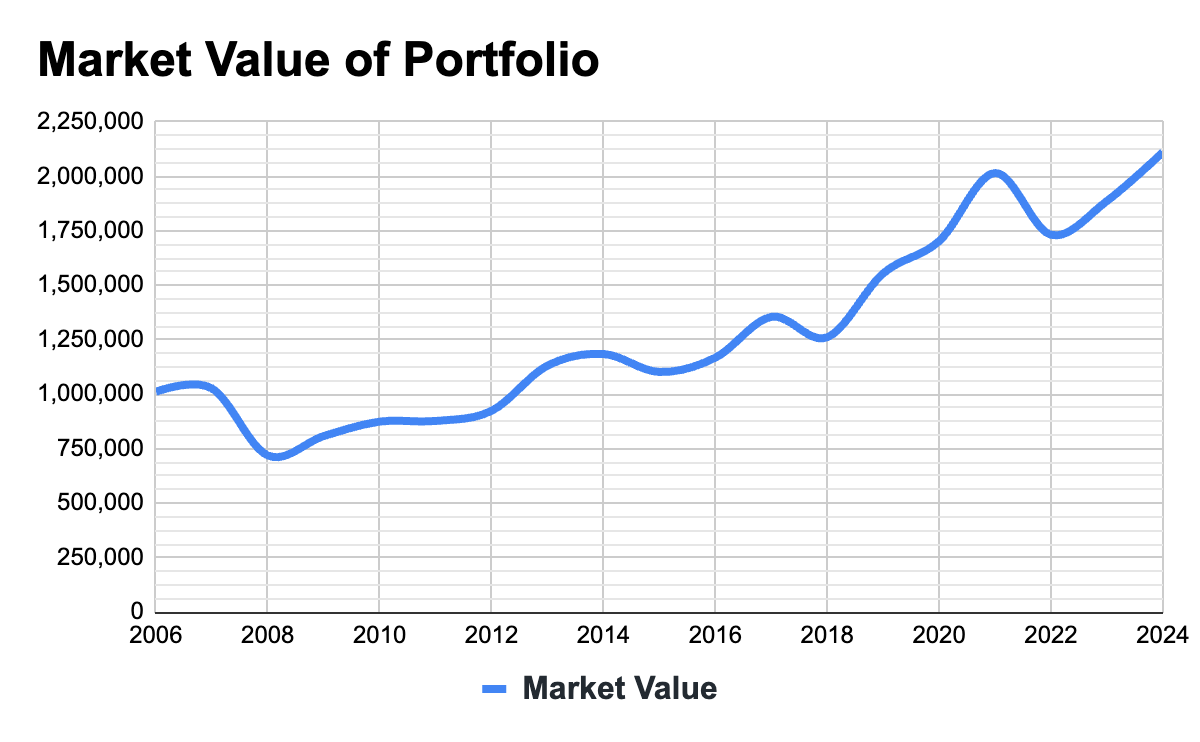
I retire with $1 million in capital and I will need $40K in annual withdrawals to supplement my income. I’ll use the actual average rate of inflation between 2006 and 2024, which was 2.39%. If the dividend income generated by VIG 0.00%↑ is insufficient to meet my inflation adjusted rate of withdrawal I will sell shares to bridge the gap.
Would VIG survive this test: YES
Would I have more capital than I started with: YES
Would I have to sell shares of VIG: YES
Would any annual withdrawals be fully covered by dividends: NO
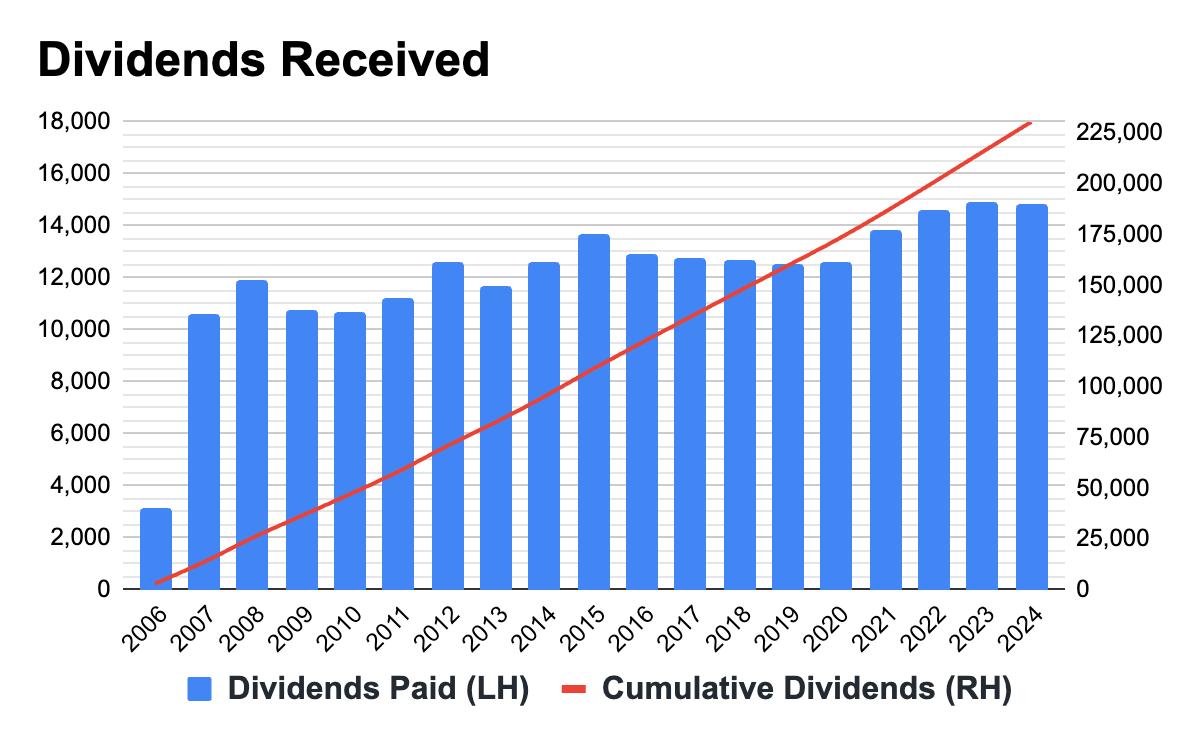
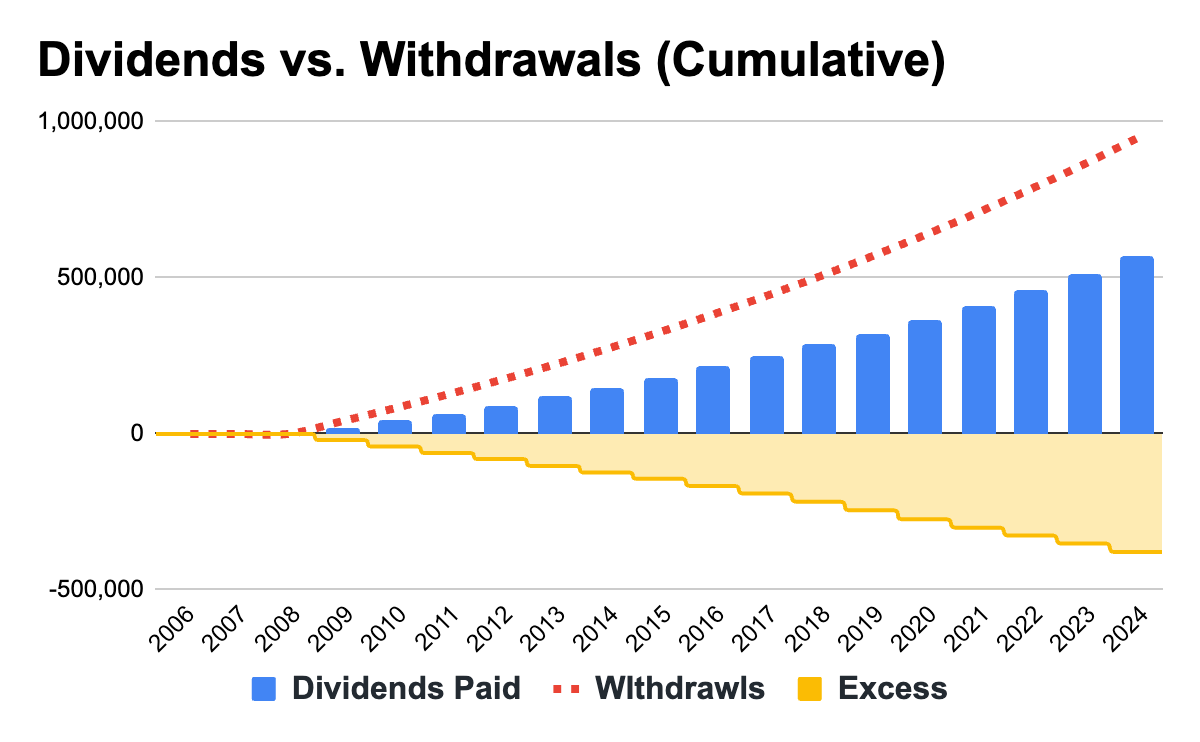
Total Withdrawals: $901,999
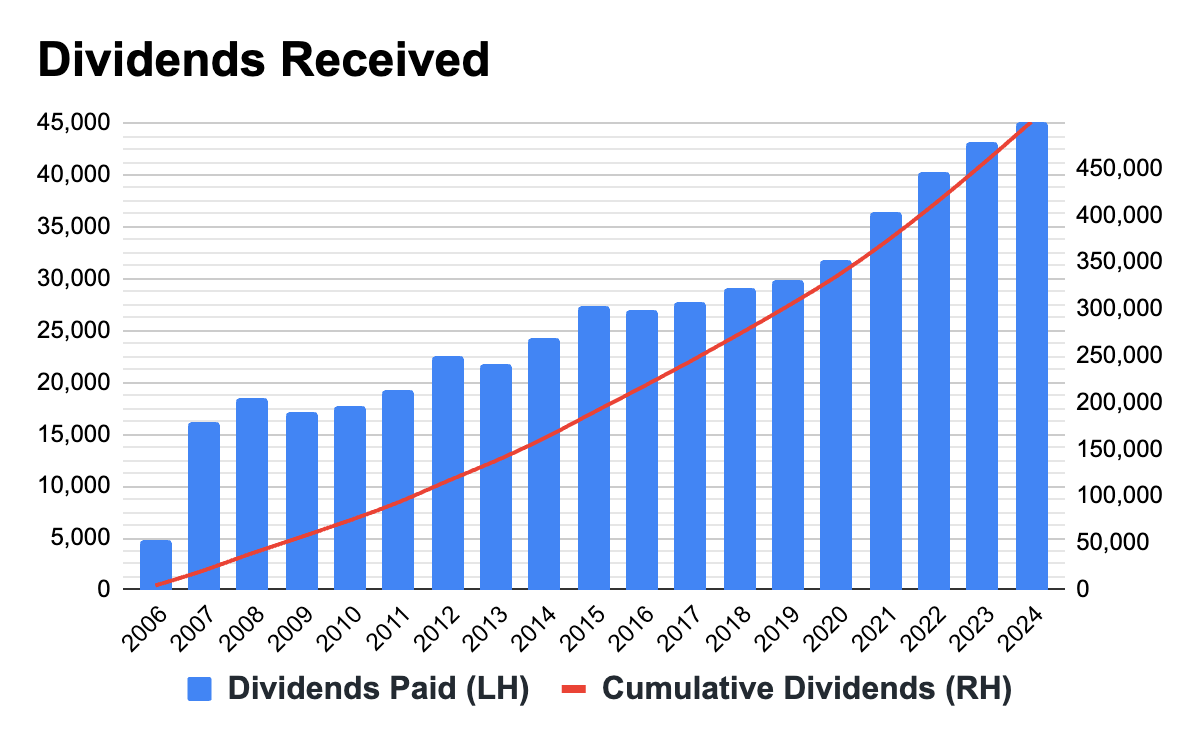
Total Dividends: $499,900
Final Market Value: $2,609,602
Lowest Market Value: $590,094
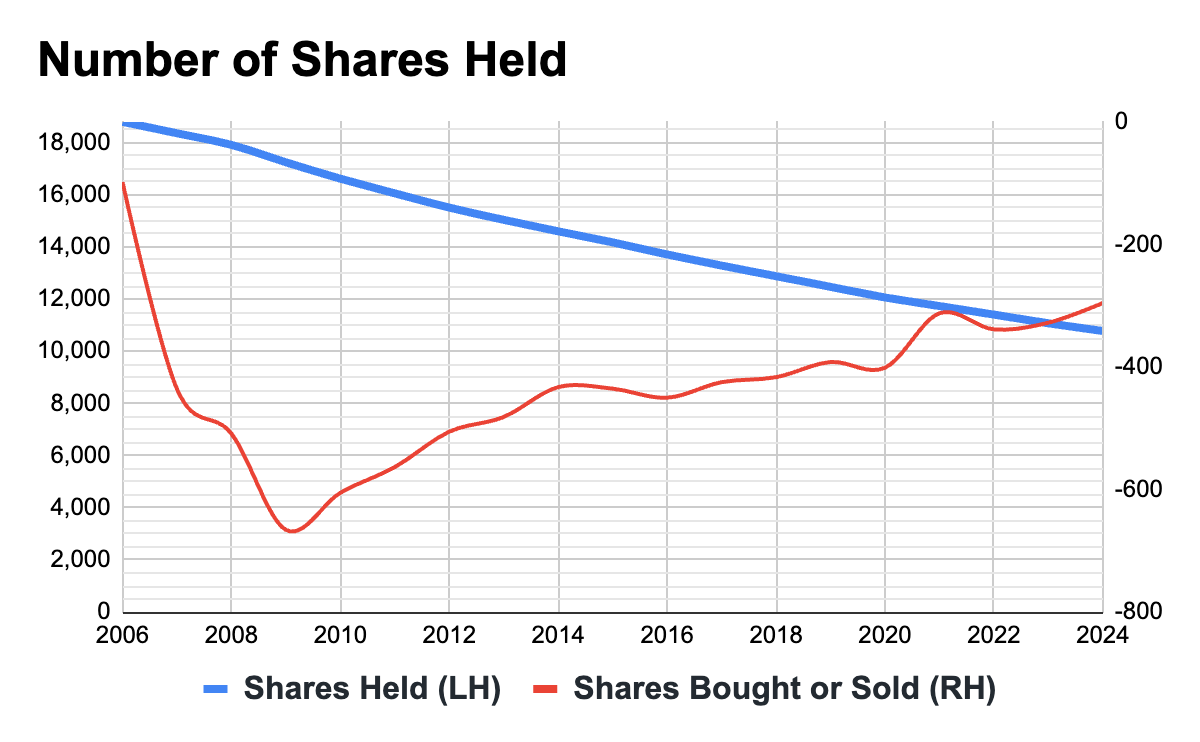
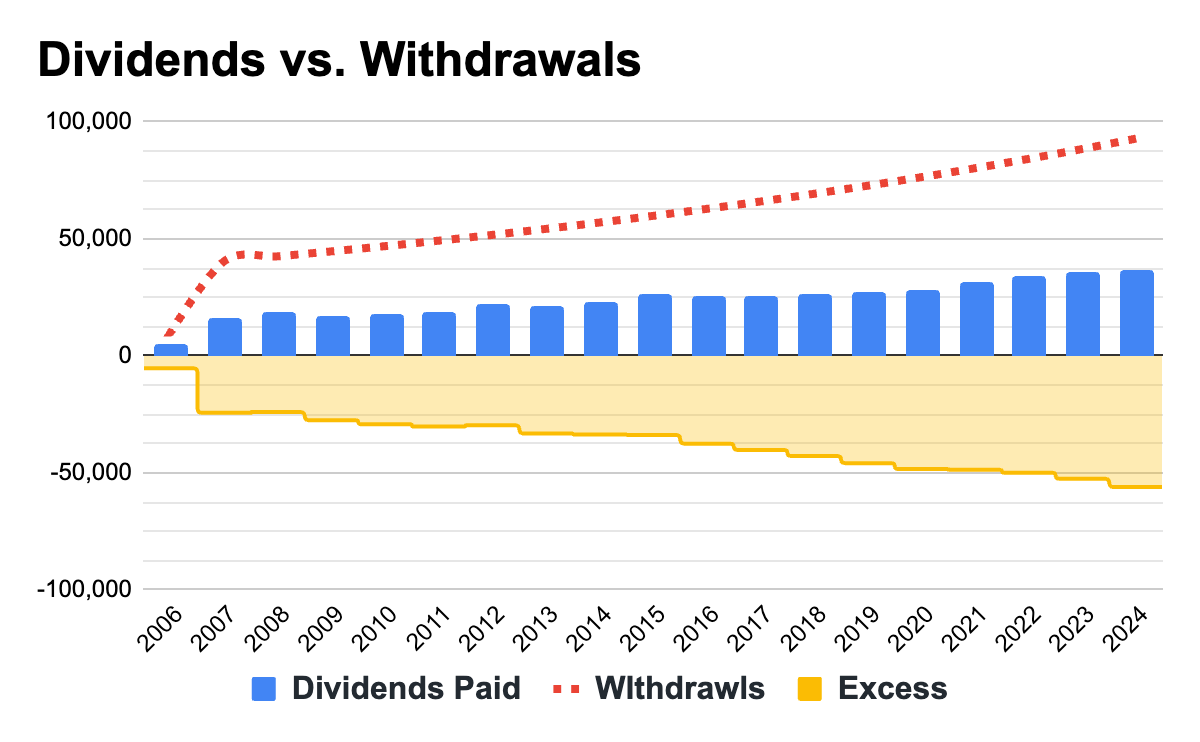
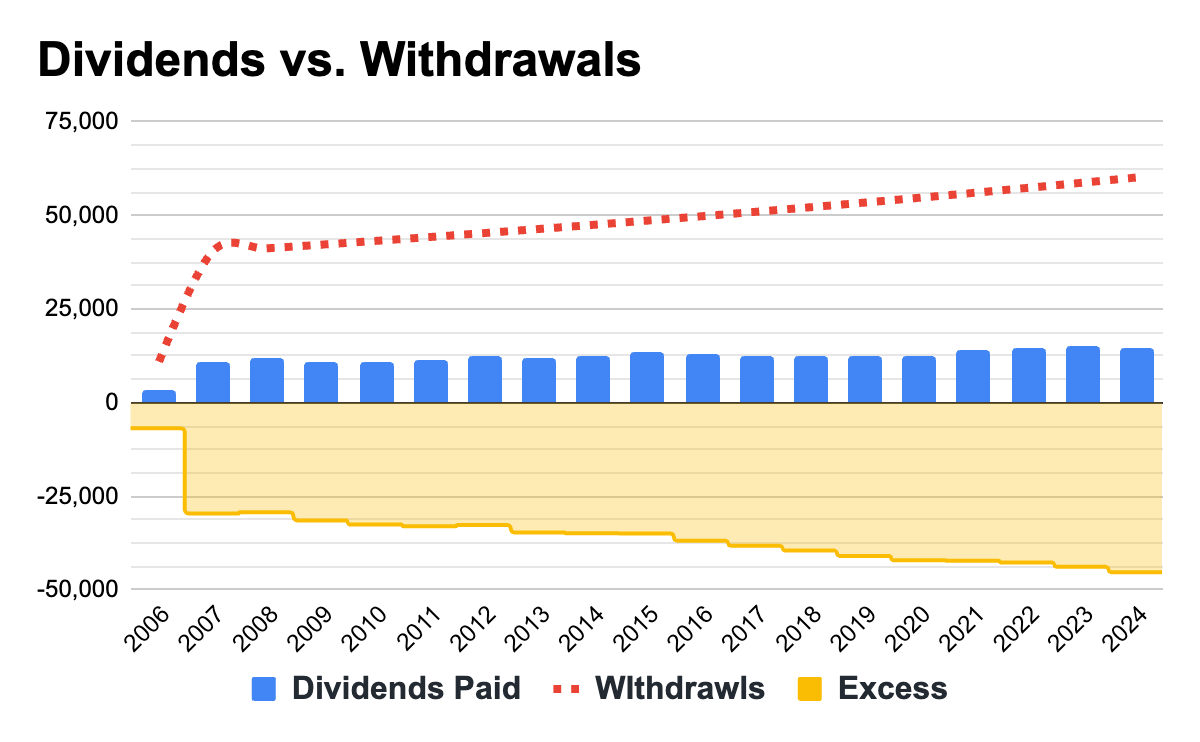
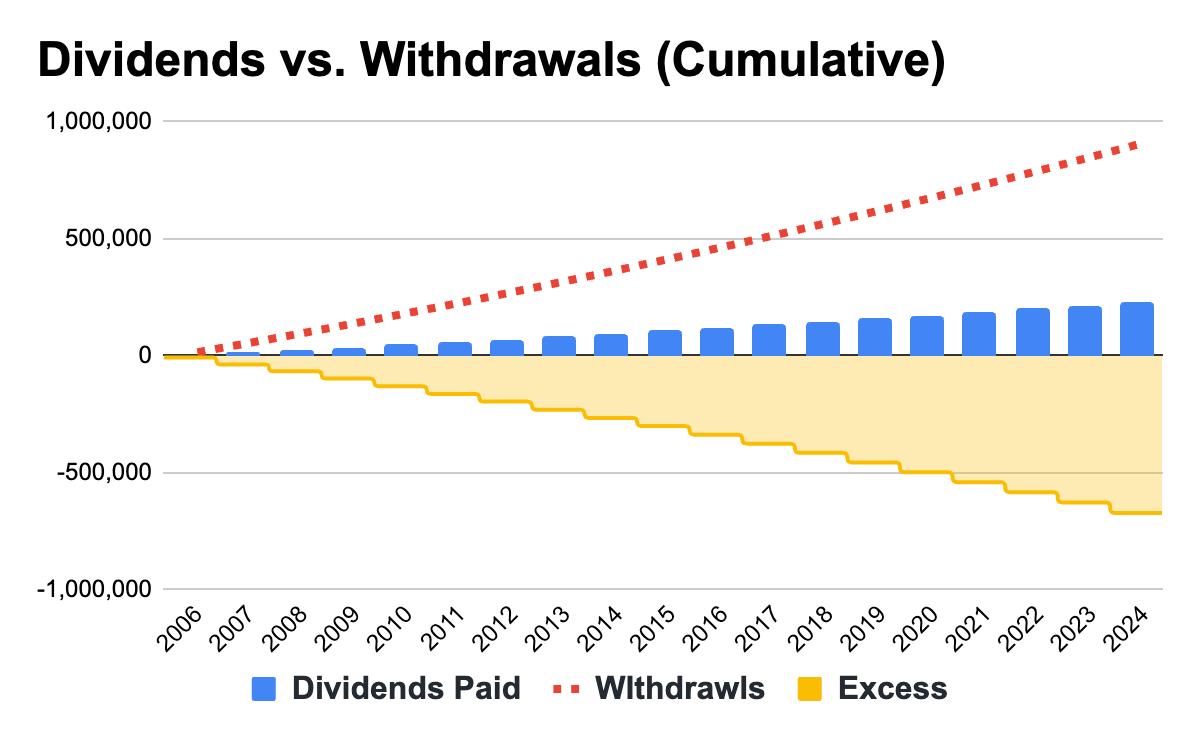
Here’s the data better visualized in charts.
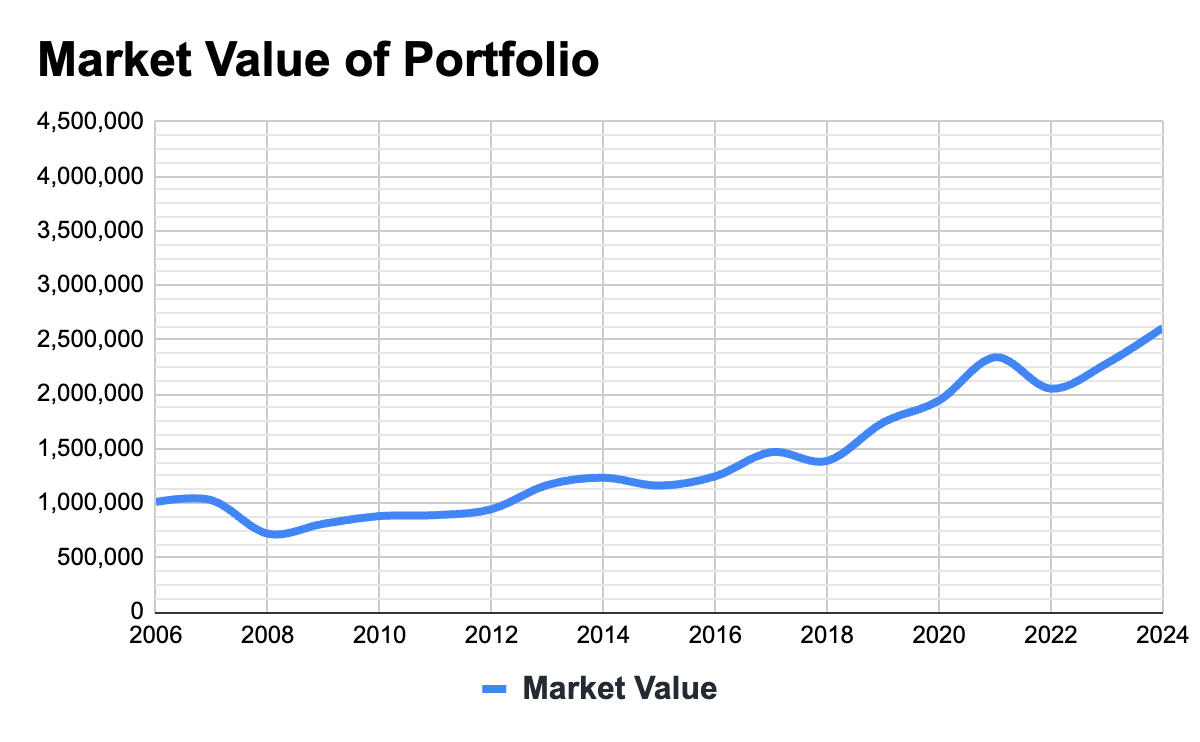
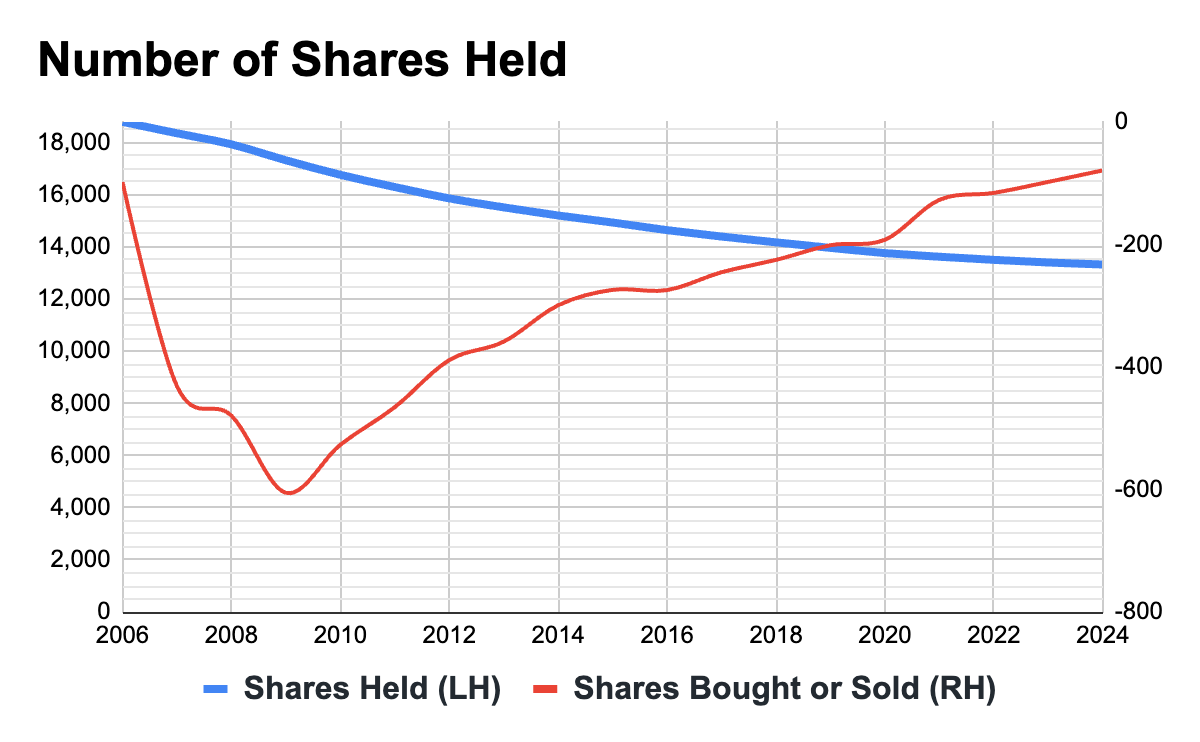
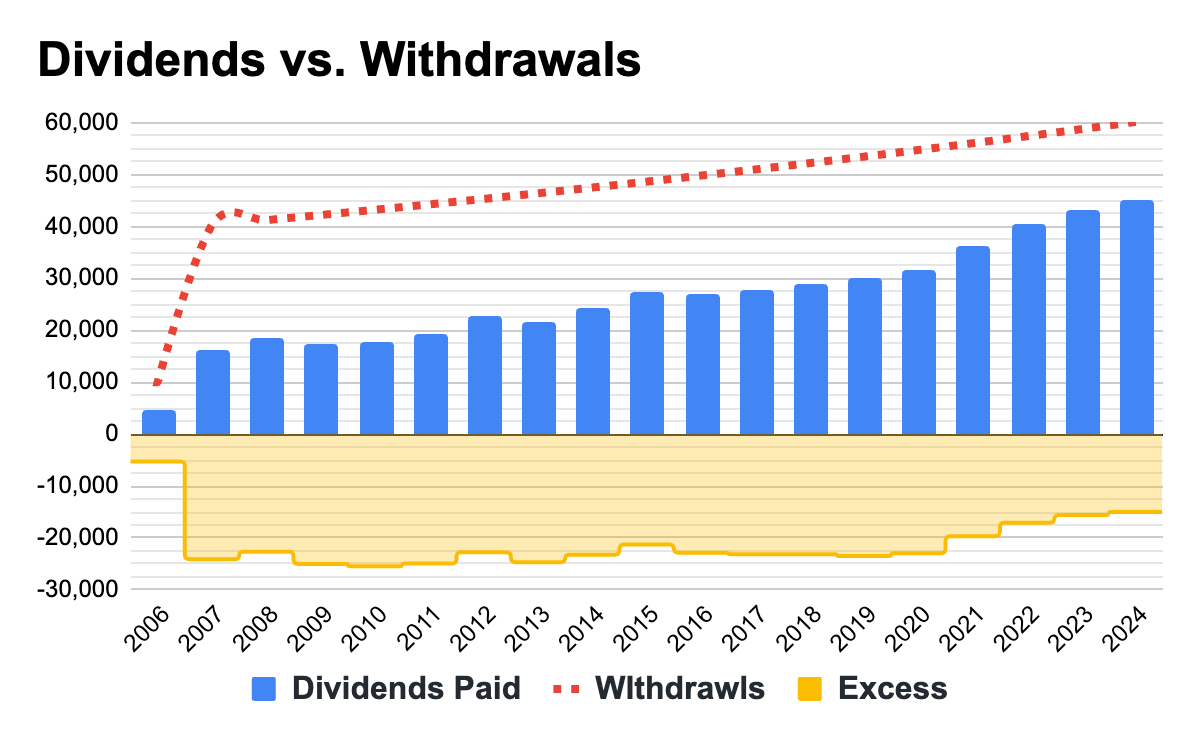

The final outcome is not too bad. We multiplied our starting capital by a factor of 2.6 all the while collecting our desired 4% inflation adjusted withdrawals. The downside is that we are consistently selling our shares, while the number of shares sold is decreasing over time we still haven’t reached equilibrium after 18 years, that is a very long time. On the bright side, the excess capital required to fund our inflation adjusted withdrawals has started shrinking significantly since the year 2021. This suggests that in due time the dividends may catch-up with withdrawals.
VIG 0.00%↑ outperforms VYM 0.00%↑ in this test as it leaves us with roughly $700K in extra capital at the end. The only upside for VYM 0.00%↑ is that it was able to fully cover a few quarterly withdrawals with dividends. While VIG 0.00%↑, at best, came up $2.6K short on a quarterly basis.
Test 2: Higher Inflation
For test number 2, lets keep all of the initial parameters equal but increase the rate of inflation from 2.39% to 5%.
Would VIG survive this test: YES
Would I have more capital than I started with: YES
Would I have to sell shares of VIG: YES
Would any annual withdrawals be fully covered by dividends: NO
Total Withdrawals: $1,149,362
Total Dividends: $456,889
Final Market Value: $2,110,457
Lowest Market Value: $588,964
Here’s the data better visualized in charts.


Overall the outcome isn’t too bad, we would still more than double our starting capital. However, we would have to sell a significant number of shares to raise capital for our annual withdrawals. Also the “dividends vs. withdrawals” chart above shows us that the dividend stream is not growing fast enough to bridge the gap to our rate of withdrawals. This tells us that this portfolio clearly will not sustain this rate of withdrawal in perpetuity, and it will begin to degrade in the future and ultimately deplete all of its capital.
While VIG 0.00%↑, in this test, would leave us with a higher final market value compared to VYM 0.00%↑, VYM’s dividend stream did a much better job of covering withdrawals. It would be an interesting race to the bottom to see which ETF could outlast the other in this scenario.
Test 3: Higher Rate of Withdrawal
In this test let’s bring inflation back down to the actual 2.39% value but let’s assume we don’t have as much capital to begin with. Instead of the original $1 million let’s assume we only have $666,666.67 and would require a 6% rate of withdrawal to generate the $40k in annual income.
Would VIG survive this test: YES
Would I have more capital than I started with: NO
Would I have to sell shares of VIG: YES
Would any annual withdrawals be fully covered by dividends: NO
Total Withdrawals: $901,999
Total Dividends: $230,591
Final Market Value: $841,454
Lowest Market Value: $373,338
Here’s the data better visualized in charts.
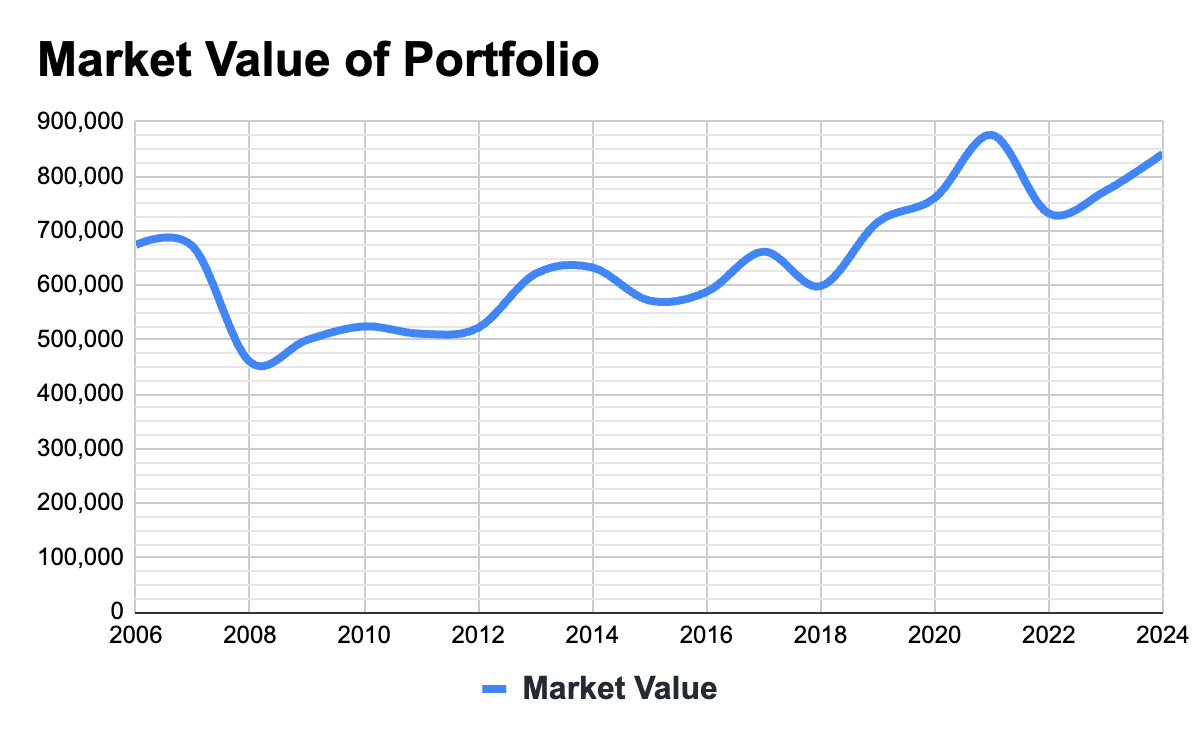

Overall, given the amount of stress, the outcome is not too bad. Over 18 years of consistent and inflation adjusted payments with just 16% loss of capital. Under normal market conditions this portfolio could likely sustain another +/- 5 years or so before it would ultimately run out of capital.
Relative to VYM 0.00%↑ this portfolio has nearly $400K in additional capital and would likely sustain this stressed withdrawal scenario for a few additional years beyond what VYM 0.00%↑ could sustain.
It was interesting to see that the dividend growth from VIG 0.00%↑ marginally offset the inflation on the rate of withdrawals. This can be visualized in the “dividends received” chart that shows the annual dividend income marginally increasing over time.
Test 4: Timing of Retirement
Timing is everything. Similar to what we did with the VYM 0.00%↑ portfolio in the prior example, lets see how our VIG 0.00%↑ portfolio performs if we had the absolute best timing possible.
Starting capital = $666,666.67
Rate of Withdrawal = 6%
Inflation = 5%
Start Date = March 2009
Would VIG survive this test: YES
Would I have more capital than I started with: YES
Would I have to sell shares of VIG: YES
Would any annual withdrawals be fully covered by dividends: NO
Total Withdrawals: $946,300
Total Dividends: $567,682
Final Market Value: $3,229,888
Lowest Market Value: $666,666.67
Here’s the data better visualized in charts.


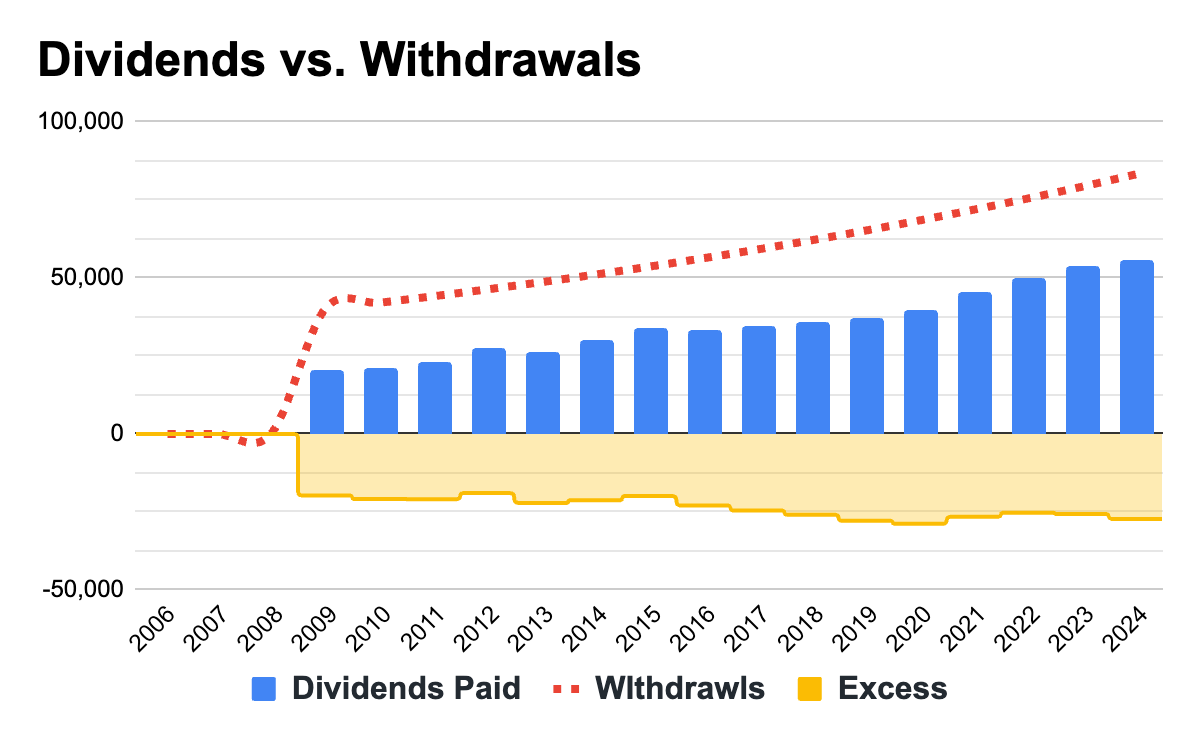
Much like we saw with VYM 0.00%↑, our perfectly timed investment into VIG 0.00%↑ performed swimmingly! Our capital multiplied 3.2 times despite the very high rate of withdrawal and more than twice historical inflation. What’s interesting to note here is that while VIG 0.00%↑ appeared to perform better in tests 1-3, it was VYM 0.00%↑ that performed better in test 4. VYM 0.00%↑ finished with a higher final market value, produced a bigger dividend stream and was actually able to catch-up and fully cover a decent number of the withdrawals. While our capital increased with VIG 0.00%↑ as well, the dividend stream was unable to make any progress in offsetting the high rate of inflation adjusted withdrawals.
I think seeing how resilient VIG 0.00%↑ and VYM 0.00%↑ were under stressed retirement scenarios can give investors comfort that these funds, and other dividend strategies, can handle a reasonable amount of stress beyond their standard dividend income retirement approach. While we seldom plan on running into such situations in our own retirements, you never know what kind of pickle life will throw your way.
VIG Accumulation
Looking at retirement scenarios may be interesting to some people, but for those that are still in the accumulation phase or perhaps just looking to get started, a more important question is whether VIG 0.00%↑ is a worthy ETF to consider. That is why I included an accumulation calculator in this spreadsheet where you can see the actual results of investing in VIG 0.00%↑.
The calculator is pretty straightforward but it allows you to play around with a few variables to see how they change the final outcome. The variables are:
Starting balance
Monthly Contribution
Re-investing Dividends
Various Tax Rates on Dividends
Start date: Monthly between June of 2006 and today
If you have not started investing yet, maybe because you don’t think you can afford to or you don’t believe a trivial amount of money will grow to anything meaningful, let me show you just what VIG 0.00%↑ could have offered.
Let’s say we had no money when we started, and we could only manage to invest $250 per month. That’s roughly $57 per week or $8.22 per day, I think any of us can scrounge up this amount of money. If you started this investment strategy in June of 2006 and you remained consistent till today, here is what you would achieve.
Total contributed: $56,250 (decent chunk of change from just $8.22 per day).
If you chose not to reinvest your dividend along the way, you would finish with:
Market Value: $149,075
Total Dividends: $18,485
Dividends in 2024: $2,464
So, you would have received back 32.86% of your contributions through passive dividend income. In 2024, you would have received 82.13% of your annual contribution back in the form of a passive dividend stream, very close to full contribution replacement. The value of your invested capital would multiply 2.65 times (not counting the dividends since they weren’t re-invested).
If you did choose to re-invest dividends along the way, you would finish with:
Market Value: $188,723
Total Dividends: $21,851
Dividends in 2024: $3,105
So, you would have received back 38.85% of your contributions through passive dividend income. In 2024, you would have received 103.5% of your annual contribution back in the form of a passive dividend stream, more than full contribution replacement. The value of your invested capital would multiply 3.36 times.
The simple choice of re-investing dividends would yield roughly $21K in additional capital in your pocket. It would give you full contribution replacement significantly faster and these figures would continue to grow exponentially.
What do you think would happen if you found an extra $25 to invest each month? That’s less than a dollar per day. Well, you would contribute $5,625 more to your portfolio, but you’d have $18,872 more capital today. You would receive more than $2k in extra dividend income along the way, and an extra $310 in dividends in 2024.
Investing should be simple and it should be easy. You don’t need a complex portfolio of the latest trending stocks to build wealth. Don’t get me wrong, investing in the next Nvidia, Apple or Monster Beverage can be very rewarding. The problem with such a strategy is that these companies aren’t easy to find and they come with a lot of volatility. It is much easier to invest in index funds or ETFs and do so passively on autopilot. You won’t become a millionaire overnight but you will sleep well at night, while compounding slowly makes you wealthier. It’s very tempting to chase trendy stocks today as we are bombarded with news all the time. You have likely seen a handful of people online showing the outstanding results they have managed to achieve in a short period of time. And it’s great that things worked out for them, but what you don’t see are the 100’s of people who got burned on the same exact stock, because people tend not to share their failures online so much as they share their lucky wins.
Give the VIG 0.00%↑ accumulation spreadsheet a spin and see if it would have offered enough dividend income and growth to get you where you’d like to be 18 years from today. You may be surprised by the results.
Free Spreadsheet
You can download a copy of this spreadsheet here. After you click on the link you will be prompted to make a copy of the spreadsheet and save it in your own google drive.
If you found this content insightful consider upgrading to a paid subscription. You can see the live valuation ratings for my Top High Quality Dividend Growth Stocks here, at any time. Additionally, you’ll gain access to a complimentary Stock Valuation Tool for 227 Quality Dividend Growth Stocks. The paid subscription is only $5 per month and you can cancel any time.
Check out these Dividend Tools to help you on your investing journey:
Follow Me On Other Social Media Platforms
Link to Youtube
Link to X @LongacresFin
First!
I really enjoy your overall approach and commentary!