

Would VYM Be Good Enough For Your Retirement?

It’s real easy to get caught up in the “Now” of investing that you don’t give much thought to the actual retirement part. Sure you watch your dividend income grow over the years and forecast out into the future, but do you actually have a plan in place for retirement and beyond?
I wanted to test the simplest concept for funding retirement just to give me some perspective on how it could possibly play out. Last September I wrote a piece comparing dividends to the 4% rule, where I tested the resiliency of SCHD against a more conventional retirement portfolio. You can find out about the outcome of that comparison here. Today I want to take that analysis one step further, I want to stress test another popular dividend ETF, Vanguard’s High Dividend Fund VYM 0.00%↑.
In addition to the insights from this analysis that I will share with you below, you can download a copy of my test spreadsheet to run your own scenarios. A link is provided at the end.
Breakdown of VYM 0.00%↑
Vanguard’s popular high dividend ETF currently sports a 30-day SEC yield of 2.68% (as of 12/31/24). It charges an industry low expense ratio of just 6 basis points (0.06%). This ETF is made up of 533 unique stocks with a focus on US Large Cap Value and dividend income and growth of course. With $61 billion in assets under management, VYM 0.00%↑ is the third largest ETF targeting a dividend investing strategy. The two larger ETFs are Schwab’s US Dividend Equity ETF SCHD 0.00%↑ and Vanguard’s Dividend Appreciation ETF VIG 0.00%↑.
VYM 0.00%↑ has been around since 11/10/2006 and has generated a total return CAGR of 8.61% since inception.
So let’s see how a one fund retirement would have looked like with this popular dividend ETF.
Long-Term Results Breakdown
Let’s assume you retired in December of 2006 with X dollars of capital and you decided to invest all of this money into VYM 0.00%↑. Would this dividend ETF be able to provide sufficient income to fund your retirement?
Let’s run a few hypothetical scenarios to see just how well VYM 0.00%↑ would have performed.
To keep this test simple I’m going to only change around 4 variables.
Starting Capital
Required Rate of Withdrawal
Inflation
Start Date of Test
Test 1: The 4% Rule
I retire with $1 million in capital and I will need $40K in annual withdrawals to supplement my income. I’ll use the actual average rate of inflation between 2006 and 2024, which was 2.39%. If the dividend income generated by VYM 0.00%↑ is insufficient to meet my rate of withdrawal I will sell shares to bridge the gap.
Would VYM survive this test: YES
Would I have more capital than I started with: YES
Would I have to sell shares of VYM: YES
Would any quarterly withdrawals be fully covered by dividends: YES (4 out of 73)
Total Withdrawals: $901,999.19
Total Dividends: $654,507.48
Final Market Value: $1,939,894.92
Lowest Market Value: $479,441.55
Here’s the data better visualized in charts.


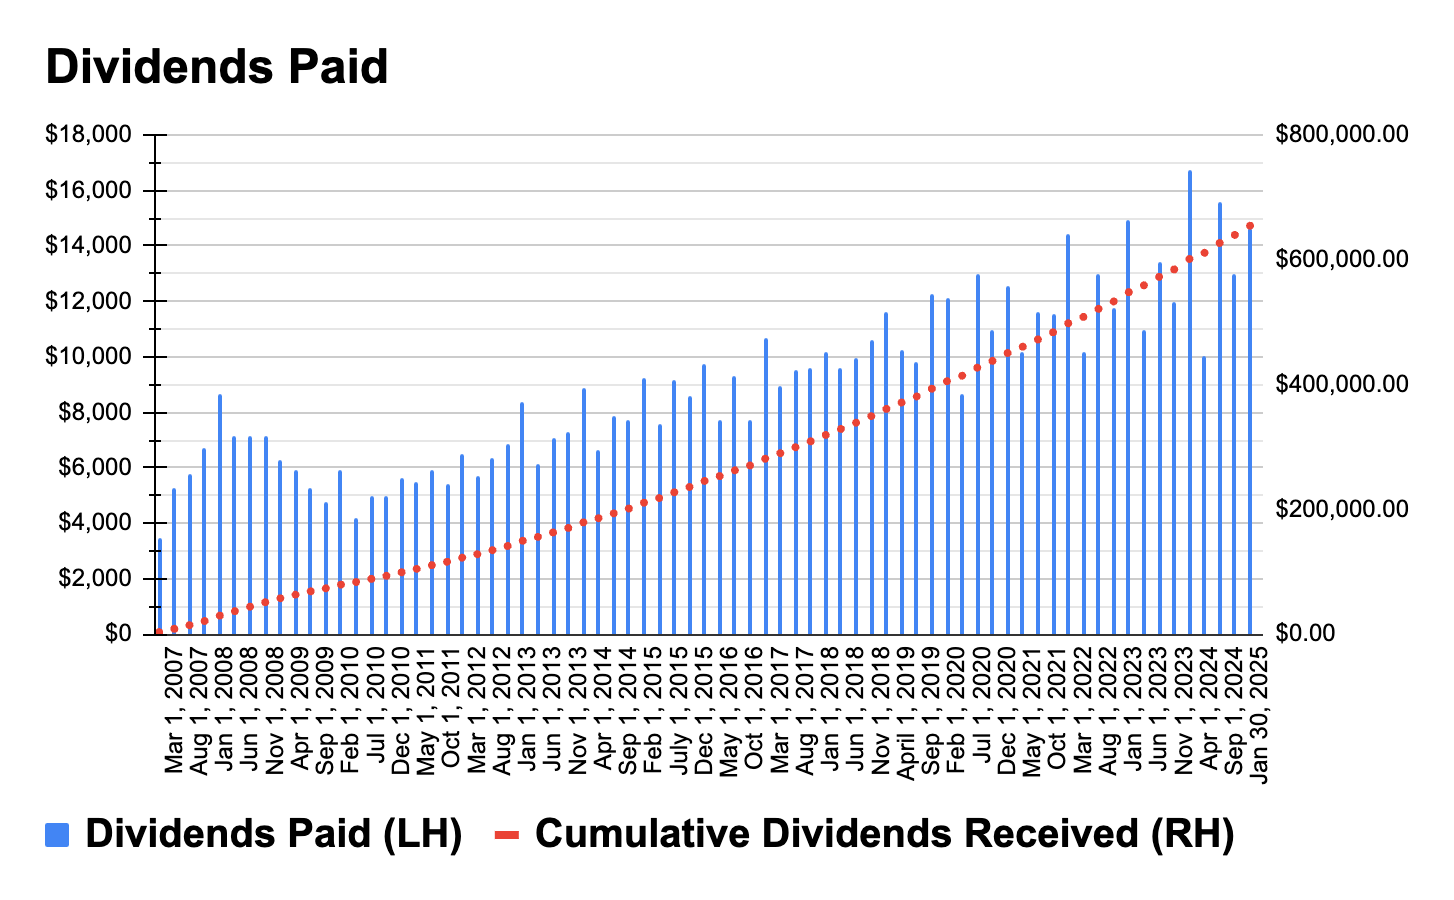


Overall the final outcome is pretty great. Your capital almost doubles while the portfolio is able to fund your inflation adjusted withdrawals. The downside, you had to sell quite a lot of shares along the way and the portfolio value dipped significantly during the Financial Crisis.
Looking closer at the chart showing the number of shares held we can tell that it was the Financial Crisis that really stressed this portfolio. The bulk of shares were sold during this period and in more recent years a few dividends not only fully covered withdrawals, they provided an opportunity to add new shares.
Test 2: Higher Inflation
For test number 2, lets keep all of the initial parameters equal but increase the rate of inflation from 2.39% to 5%.
Would VYM survive this test: YES
Would I have more capital than I started with: YES
Would I have to sell shares of VYM: YES
Would any quarterly withdrawals be fully covered by dividends: NO
Total Withdrawals: $1,149,361.58
Total Dividends: $588,975.31
Final Market Value: $1,480,360.50
Lowest Market Value: $478,442.25
Here’s the data better visualized in charts.


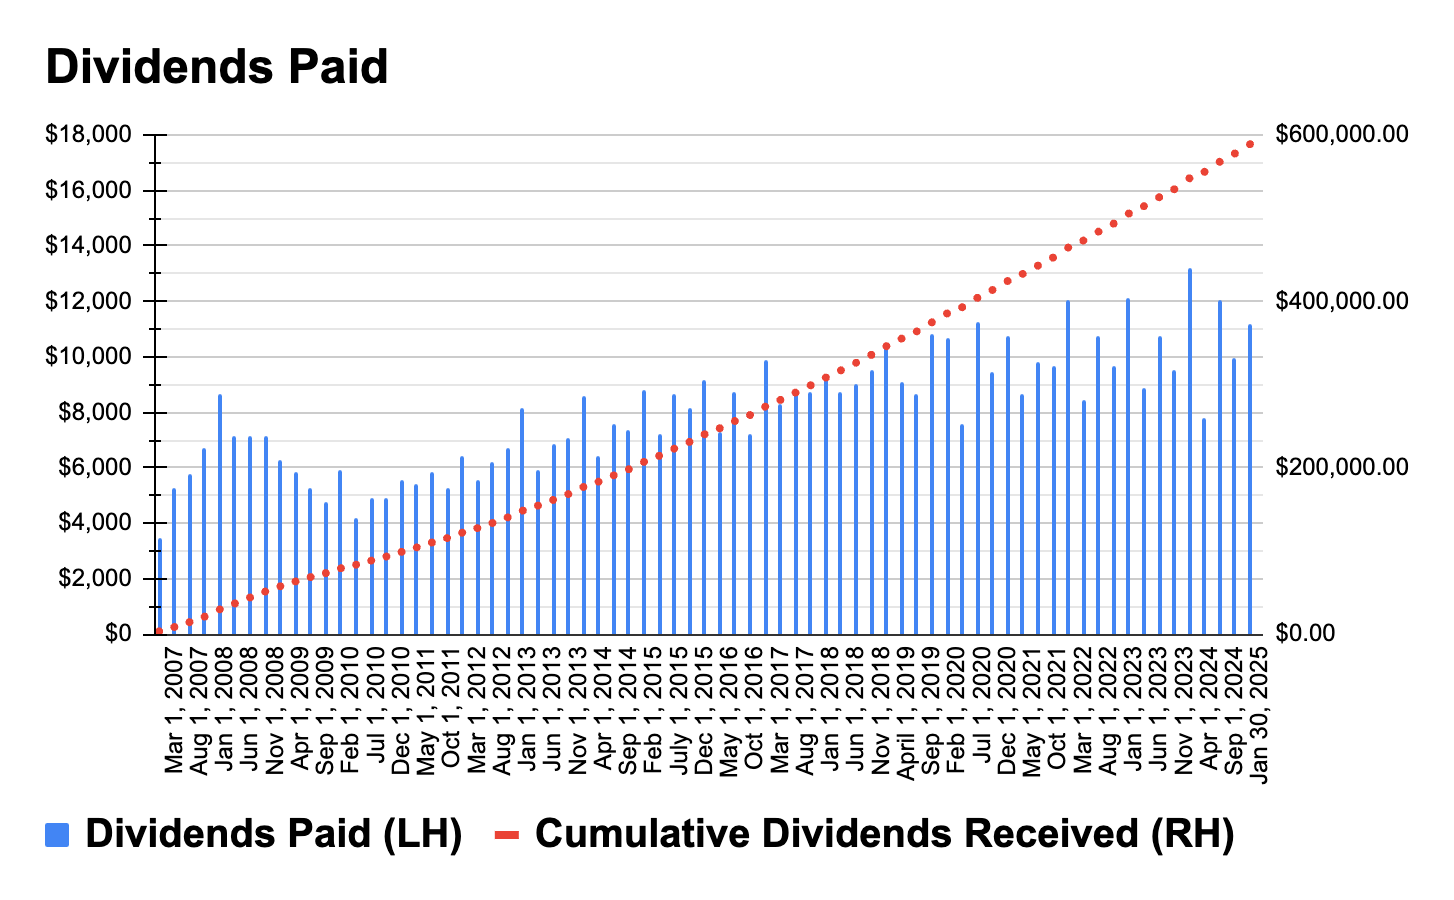


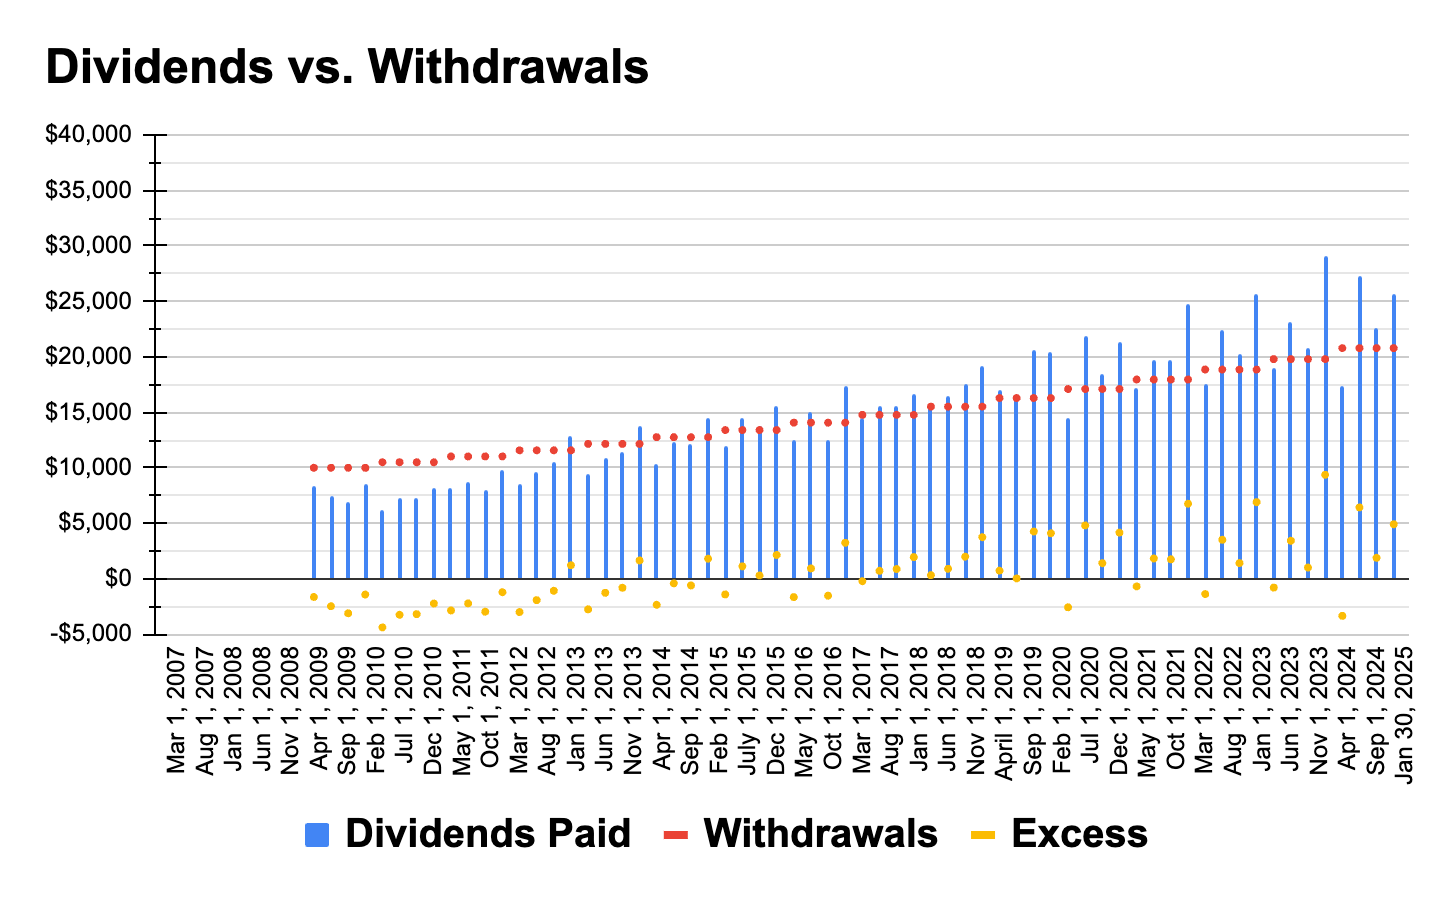
Overall the final outcome again is not bad. You’d finish with about 1.4X the capital you started with and VYM 0.00%↑ would be able to fund your withdrawals even with more than double the actual inflation rate.
However, there could be cause for concern with this scenario going forward. The dividend income did not catch up to the rate of withdrawal and in the “Dividends vs. Withdrawals” chart above you can notice the “Excess” capital required to fund withdrawals is progressively increasing over time. If this trend would continue to persist the portfolio would hit a tipping point and eventually start to decline in value.
Test 3: Higher Rate of Withdrawal
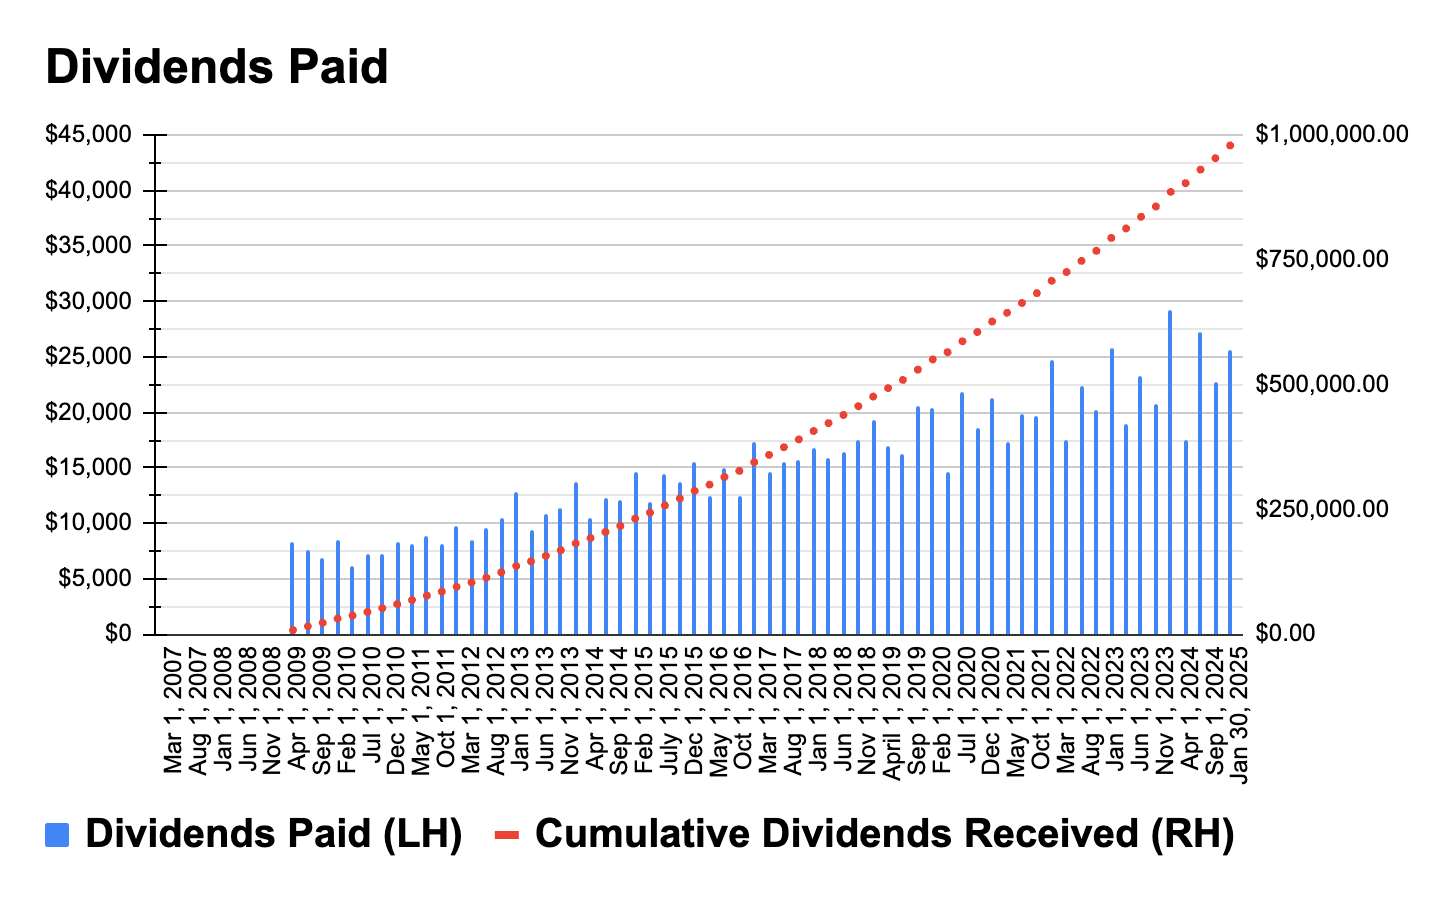
In this test let’s bring inflation back down to the actual 2.39% value but let’s assume we don’t have as much capital to begin with. Instead of the original $1 million let’s assume we only have $666,666.67 and would require a 6% rate of withdrawal to generate the $40k in annual income.
Would VYM survive this test: YES
Would I have more capital than I started with: NO
Would I have to sell shares of VYM: YES
Would any quarterly withdrawals be fully covered by dividends: NO
Total Withdrawals: $901,999.19
Total Dividends: $280,740.40
Final Market Value: $480,735.16
Lowest Market Value: $302,548.09
Here’s the data better visualized in charts.


While VYM 0.00%↑ would have been able to sustain this 18 year retirement period while meeting the necessary rate of inflation adjusted withdrawals, the patterns in the data suggest that it would ultimately fail. The excess capital required to fund the rate of withdrawals progressively increases over time and also hampers future dividends.
We would need to liquidate about 72% of our original shares of VYM 0.00%↑ in this test.
Test 4: Timing of Retirement
Timing is everything. So let’s see how this test would change had you started your retirement at the absolute best possible time, March of 2009. To show you just what impact a little luck with timing in the market can have I’m going to combine the stress of Tests 2 & 3 here.
Starting capital = $666,666.67
Rate of Withdrawal = 6%
Inflation = 5%
Start Date = March 2009
Would VYM survive this test: YES
Would I have more capital than I started with: YES
Would I have to sell shares of VYM: YES
Would any quarterly withdrawals be fully covered by dividends: YES (34 out of 63)
Total Withdrawals: $946,299.68
Total Dividends: $979,087.28
Final Market Value: $3,400,816.62
Lowest Market Value: $666,666.67
Here’s the data better visualized in charts.
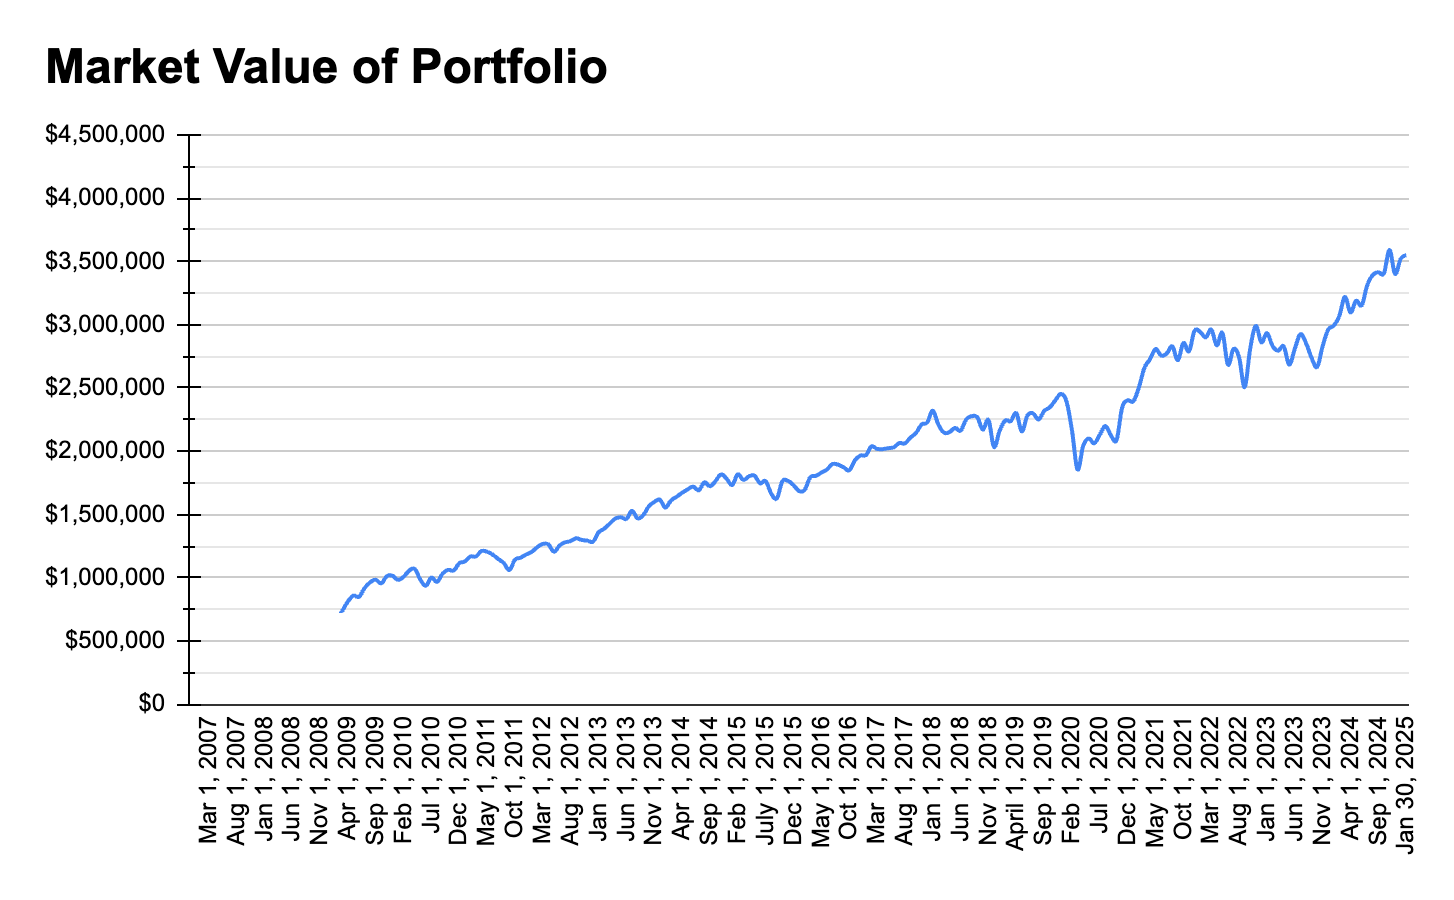


Wow, how much difference a little luck in timing can make. Of course we don’t have the luxury of deciding what market period will come around shortly after we retire.
Takeaway
It was insightful to see that despite the brutal impact of the Financial Crisis VYM 0.00%↑ was able to sustain reasonable withdrawal assumptions. I realize that dividend funds are meant to be used for dividend income and selling shares to create excess income defeats the purpose of a dividend strategy. But you never know what life is going to throw you in the future. What if you retire with a dividend portfolio and you find that your dividend income is insufficient to meet your income needs. You may be forced to liquidate shares. I think its useful to know that selling a small portion of shares of a fund like VYM 0.00%↑ would not overly stress your retirement portfolio.
The reason VYM 0.00%↑ worked, especially in the first test, is largely due to the fact that this fund was able to offer a reasonable level of capital appreciation on top of its growing dividend stream. During the Financial Crisis, using month end data, the price of VYM 0.00%↑ declined by nearly 60%. From the bottom of the Financial Crisis through the end of January 2025 the price of VYM 0.00%↑ increased by nearly 500%.
There are plenty of dividend funds that currently offer yields significantly higher than VYM 0.00%↑. This may offer you the option to retire much sooner than you maybe initially planned. But you should consider the possibility that you may require capital appreciation should you find yourself in a situation where the dividend income your portfolio generates is insufficient to meet the income you may need.
Here is a link to the test spreadsheet where you can run your own scenarios to see exactly how retiring with VYM 0.00%↑ would have looked like.
You can change the 4 input variables and the graphs and data table below will update automatically.
https://docs.google.com/spreadsheets/d/1hMZuesCOp3wd1qn-3r7JyU6NC-hGs0UmuQGiQIjcVKQ/copy
If you found this analysis and the shared spreadsheet insightful let me know in the comments if you’d like to see this analysis applied to another dividend ETF.
Great. This is just perfect and I wonder how VIG would perform in a similar test.
Perfect. This is what every investor that works 40 hrs a week and coaches ball is looking for. I would love to see this done once a month on the flavor of the month. I would be nice to see the yearly numbers tho. That would give more or a reality check to see the year by year $…. Also, thanks for doing a fund that includes 2008. We all wonder what would happen if we went thru that ourselves pulling out money for retirement. You made my day.