W.W. Grainger, Inc. (GWW)
Company Description
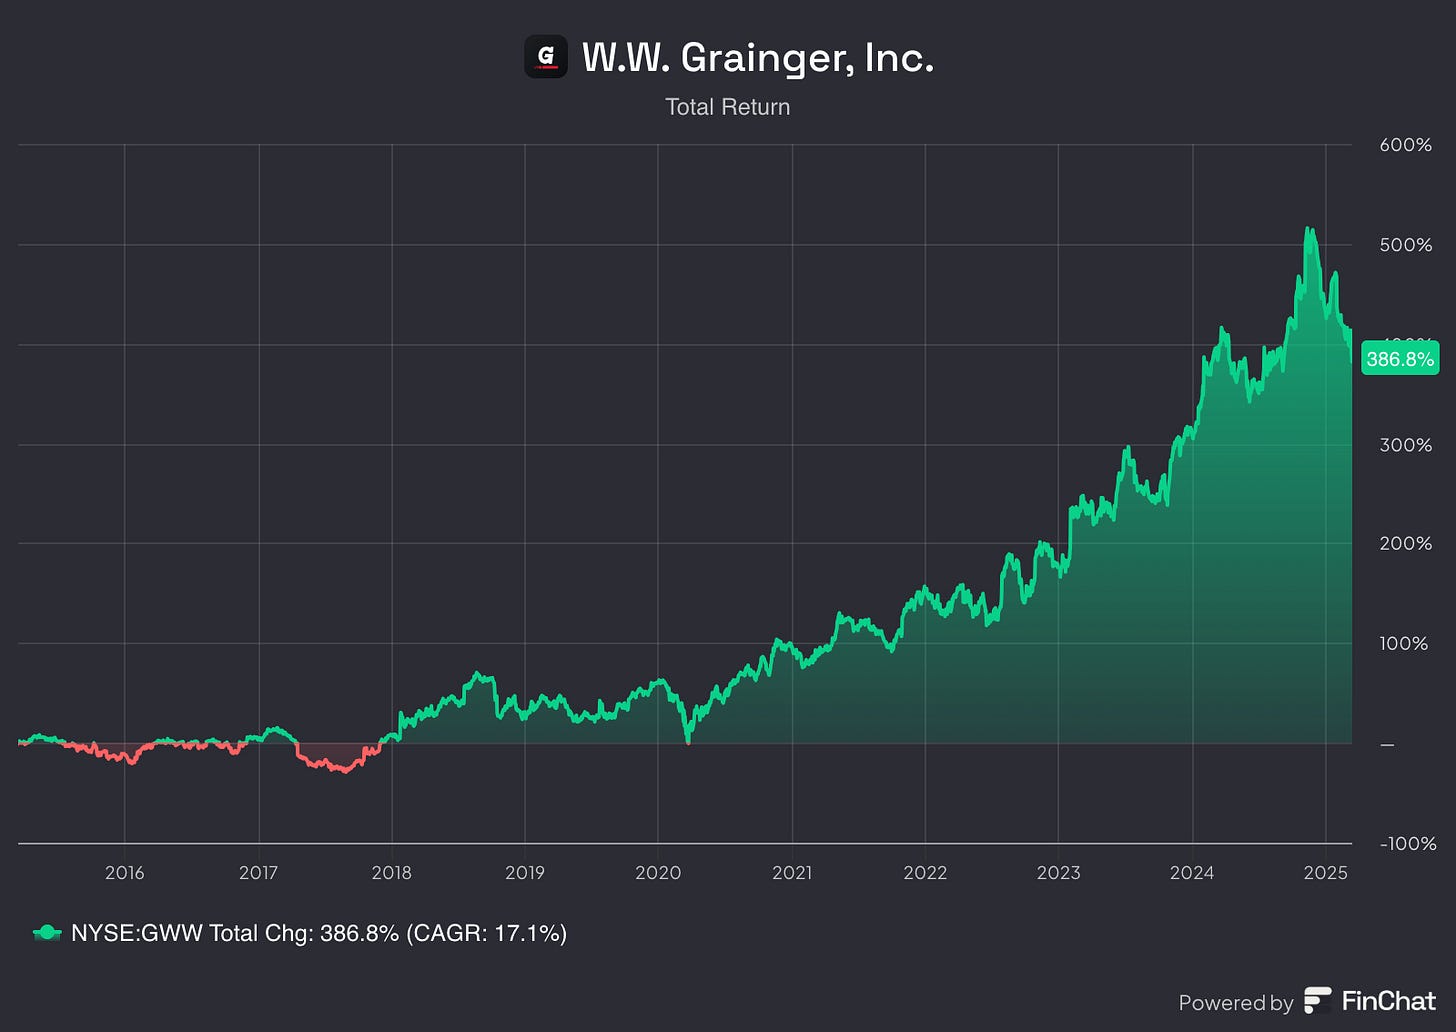
W.W. Grainger GWW 0.00%↑ is an American Fortune 500 company and a leading distributor of maintenance, repair and operating products and services. The company was founded in 1927 by William Grainger and initially focused on providing a reliable supply of electric motors to companies. Over the years it has transformed into a global enterprise, with more than 4.5M customers worldwide. GWW 0.00%↑ operates a vast distribution network that includes more than 300 branches and more than 30 distribution centers as well as online. Over the past decade the company has a total return just shy of 400%, resulting in a CAGR of about 17%.
Additionally, here are some of Grainger’s current financial metrics.
Quality Metrics
As you know, we like to review three important financial metrics to determine if the company we are looking at is of high quality. We examine the revenue per share, gross profit margin and return on invested capital.
As you can see by the red bars below GWW 0.00%↑ has grown its revenue per share at a very healthy rate of almost 10% annually since 2015. The growth hasn’t always been even with some years obviously better than others. For example, in FY19 and FY20 the RPS only grew by 5% each year, while decent, that growth was nowhere near 2021 and 2022 where it grew by 13.8% and 19.2%, respectively. This metric is also boosted by the company consistently repurchasing their stock which has been almost 3% annually over the past 10 years.
The gross profit margin, as indicated by the blue line, dipped around the pandemic to a low of 35.9%. This was a decline of about 650 basis points from its high in FY 2015. Since the pandemic this metric has rebounded, although not quite to pre-pandemic levels, but it nearly reached 40% just last year.
GWW 0.00%↑ return on invested capital is one of the best I’ve seen and has been climbing over the years. As you can see on the chart, the ROIC has been on an overall upward trend, going from between 17% and 20% during 2015-2017, to around 25% over the next four years, and in the most recent three years this metric has surpassed 30%, including almost 35% in FY24.
Overall, these metrics are very impressive, with the revenue rising, a rebounding GPM and an ever-expanding return on invested capital, you’d be hard-pressed to find a company with better metrics. Based on this information, GWW 0.00%↑ is obviously a very high-quality business worthy of consideration from dividend investors.
Dividend Data
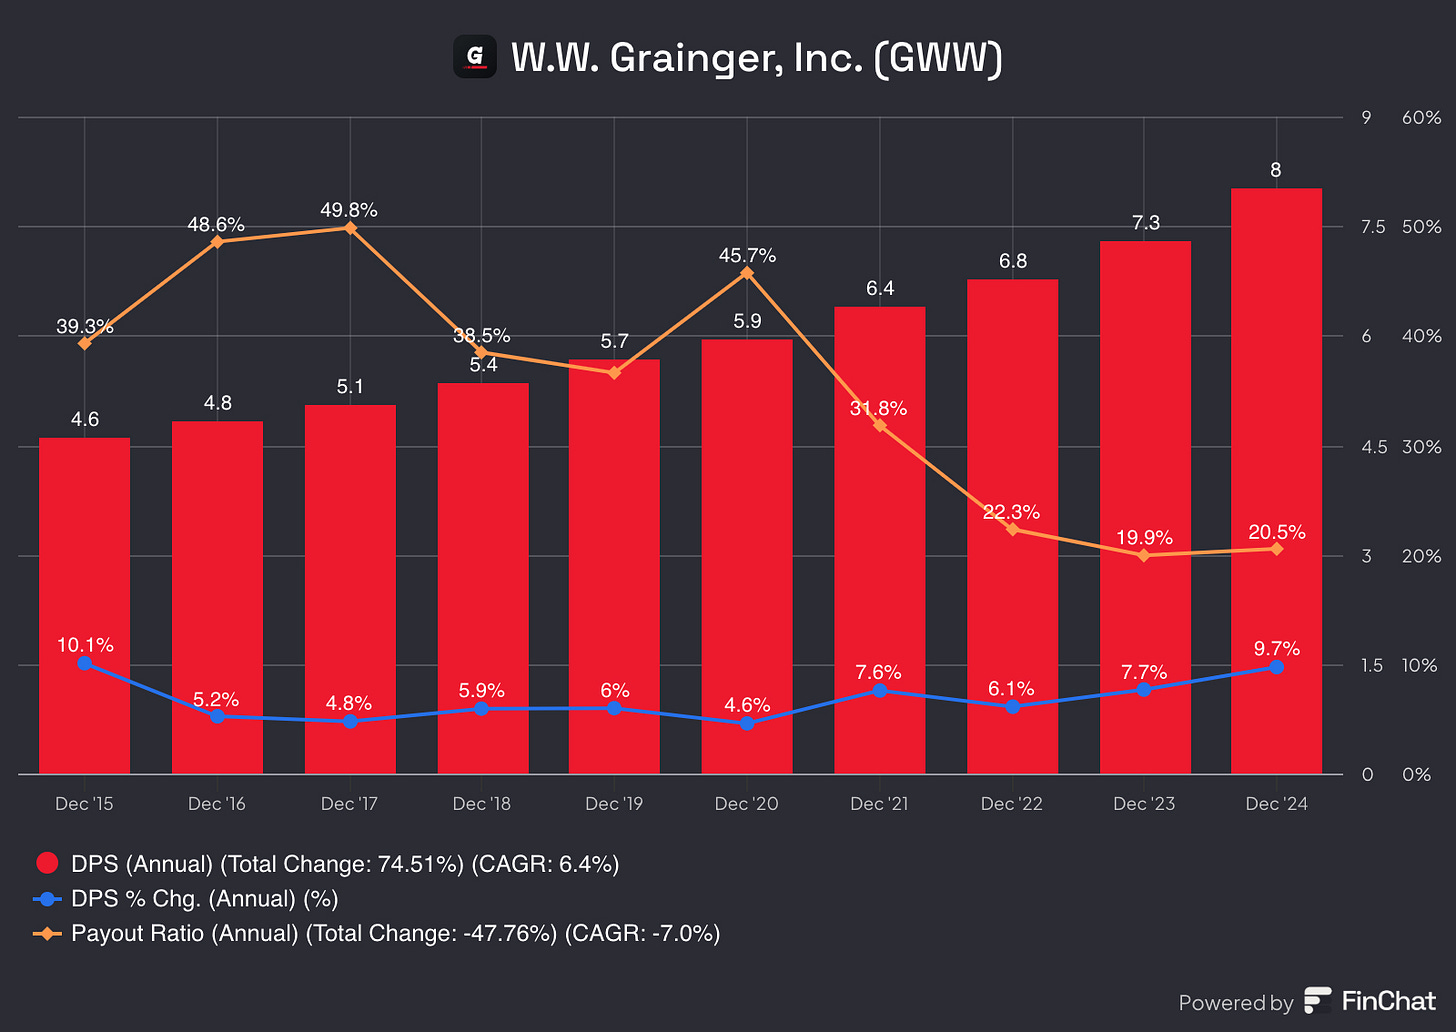
Grainger is Dividend Aristocrat and a Dividend King having raised its dividend for 53 consecutive years, including a 9.7% increase announced last year. This increase was better than its 3-, 5- and 10-year dividend growth rates which are 7.8%, 7.1% and 6.4%, respectively. Although the dividend increases are not as impressive as one might like to see, they do outpace inflation which is always a positive sign, and the longevity is hard to ignore. Lastly, the payout ratio has retracted by more than 50% in recent years, allowing for the company to continue offering investors solid dividend growth.
Potential Headwinds
Grainger is an industrial giant with strong name recognition and reliable customers. However, even the best companies aren’t without potential issues, let’s dive into some for GWW 0.00%↑.
Due to the nature of their business, supply chain disruptions is an obvious potential problem. Raw material shortages, shipping delays, among other things can all cause problems for Grainger and their customers; and events outside of their control can exacerbate the problem, like a pandemic.
Amazon Business presents a potential headwind as well. It’s known that Grainger has a lot of “larger” clients and at the moment Amazon Business has more small-to-medium sized clients, and is typically focused on order fulfillment. However, it’s hard to ignore “The Amazon Effect” in any space where that company has a footprint, and GWW 0.00%↑ should be weary of their presence. Along those same lines, stiffer competition from e-commerce companies (not named Amazon) are also rising such as Home Depot Pro, who has been aggressively targeting business customers as well.
Thus far, Grainger has thrived throughout its long history but newer competition could cause headaches in the near future. It’s imperative GWW 0.00%↑ continues to develop itself and adapt to ever-changing market conditions as needed to stay competitive…they’ve done well so far but time will tell if they can continue.
Q4 2024 & Full-Year w/2025 Guidance
GWW 0.00%↑ announced Q4 earnings in late January with a double miss. Non-GAAP earnings per share missed by $0.03, coming in at $9.71 per share on revenue of $4.2B. That revenue mark was a 6% increase from the same quarter last year but came up short of expectations by $40M.
Looking at the revenue for the two segments of the company…High-Touch Solutions grew 4% on an organic constant currency basis when compared to Q4 2023. Additionally, sales in the Endless Assortment segment surged 15.1% on a constant currency basis, and was the result of core B2B customers as well as growth at MonotaRO. For the full year, revenue grew 4.2% versus 2023.
Moving on to earnings, operating earnings for the quarter were $633M, a 13.6% increase from 2023. While the operating margin was 15%, expanding by 110 basis points compared to Q4 2023. Furthermore, adjusted operating earnings climbed 8.6%, with the adjusted operating margin expanding 40 bps.
As mentioned above, diluted earnings per share was $9.71 for the quarter, a 23% increase from last year, while adjusted EPS was up 16.6%. EPS was helped by a strong operating performance, lower overall share count as well as a favorable tax rate when compared to Q4 2023. Lastly, operating earnings for the year came in at $2.6B, a 2.8% increase, followed by an operating margin of 15.4% which contracted 20 bps YoY. Diluted EPS for 2024 was $38.71 an almost 7% increase from 2023, while adjusted EPS for the year was up a modest 6.2% to $38.96.
Management also offered 2025 guidance and that can be viewed on the chart below.
The full earnings call can be listened to here.
Valuation
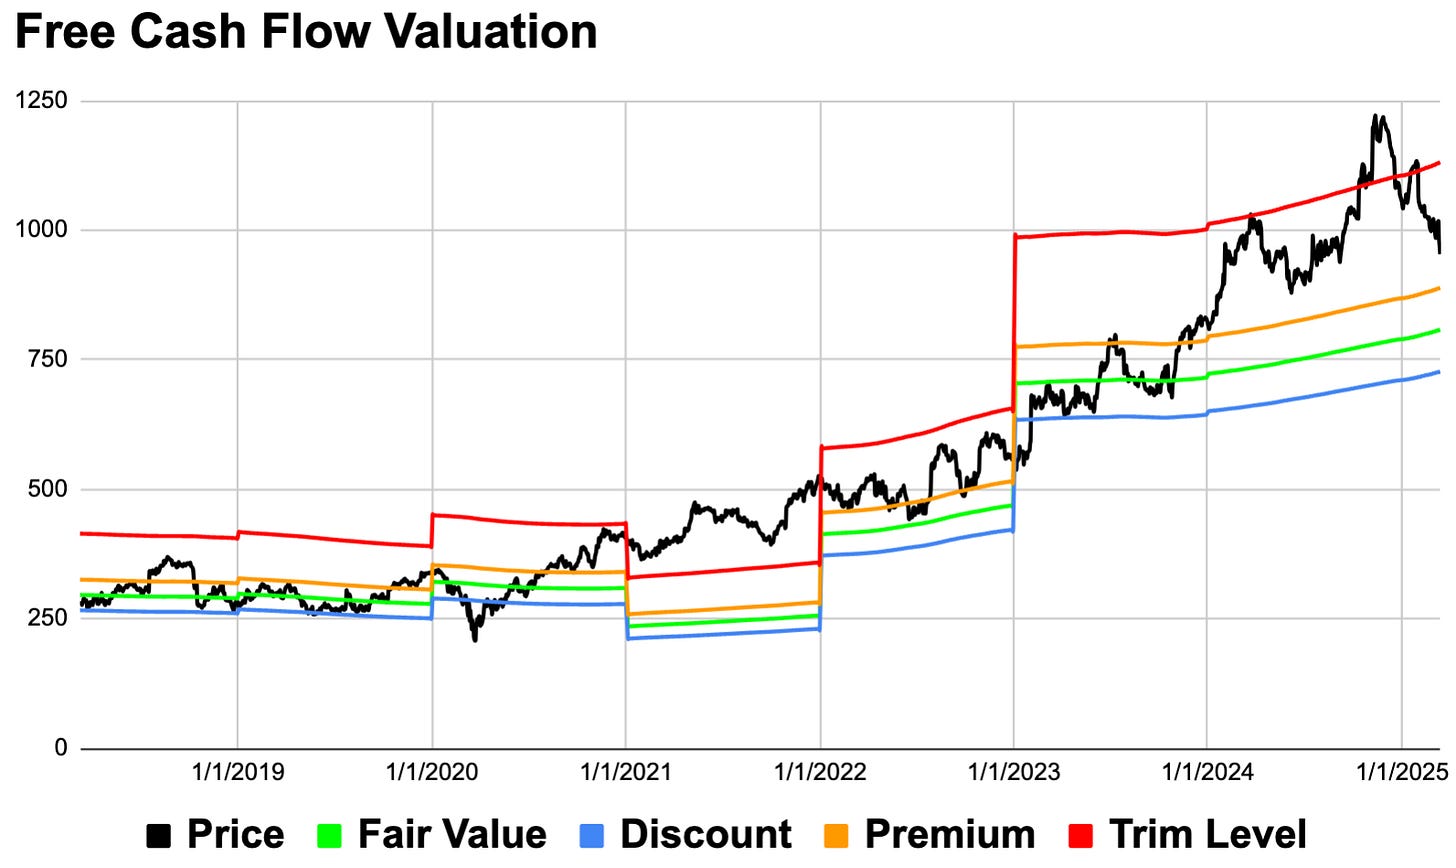
Last but not least is for us to determine if GWW 0.00%↑ is trading for an attractive valuation.
As you can see from the chart above, until recently, the company didn’t veer too far from its fair value, with 2021 being an outlier. However, the stock price appears to have gotten a little high relative to its FCF per share. This has likely occurred, at least in part, because the stock has not had one down year between 2016 and 2024, every year during that timeframe the stock price has risen (Note: the stock is down 8.5% YTD as of this writing in 2025). The recent turmoil in the stock market has brought the price down quite a bit; however, the FCF model currently suggests an approximate 18% premium, even after the recent declines.
The company has a current long-term expected return of return of 6.17%, with the components of that estimate being a 0.86% dividend yield, a -3.37% return to fair value factor, and an expected earnings growth rate of 8.68%.
In summary, GWW 0.00%↑ has some of the best financial metrics we’ve seen in these deep dives. The company has a long history of paying out a growing dividend, all while the payout ratio has been declining in recent years. Although the company may face some strong competition in the future, for the time being it appears to be thriving pretty well. Overall, it appears the stock is a big too expensive at the moment and I think investors should continue to monitor this stock, and the overall market, and wait for some price weakness before considering initiating or expanding their position.
The long-term quality score for GWW 0.00%↑ is 85.7% while the 2024 is a bit weaker at 78.2%. The biggest drag on the 2024 quality score is the 6% YoY decline in the ROIC metric, although this metric is rock solid, close to 30%.
If you found this content insightful consider upgrading to a paid subscription, you can see live valuation ratings here, at any time. Additionally, you’ll gain access to a live complimentary Free Cash Flow Valuation Tool for over 200 stocks, as well as access to our 3 model portfolios. The paid subscription is only $5 per month and you can cancel any time.
In case missed them, here are some recently covered stocks:
Moody’s Corporation MCO 0.00%↑
Allison Transmission Holdings ALSN 1.77%↑
HCA Healthcare Inc. HCA 1.66%↑
Also check out some tools to help with your investing journey
Follow on other social media platforms
Link to Youtube
Link to X @LongacresFin


