


Valuation Rating Update - Week of January 6th + More Quality Score Analysis
The stock market finished last year on a sour note with a few red days. 2025 started just like the prior year finished, on a sour note, however Friday’s rally brought some optimism for the year ahead. The S&P 500 rose by 1.26% on Friday with many individual stocks seeing much nicer gains.
This rollercoaster triggered 4 valuation rating changes in the High Quality investable universe. With all 4 being positive upgrades.
If you’re a paid subscriber you can see the live valuation ratings here, at any time. Additionally, there is a copy of my custom Free Cash Flow valuation tool currently covering 202 dividend growth stocks.
Let’s take a quick look at which stocks had a valuation change since last week.

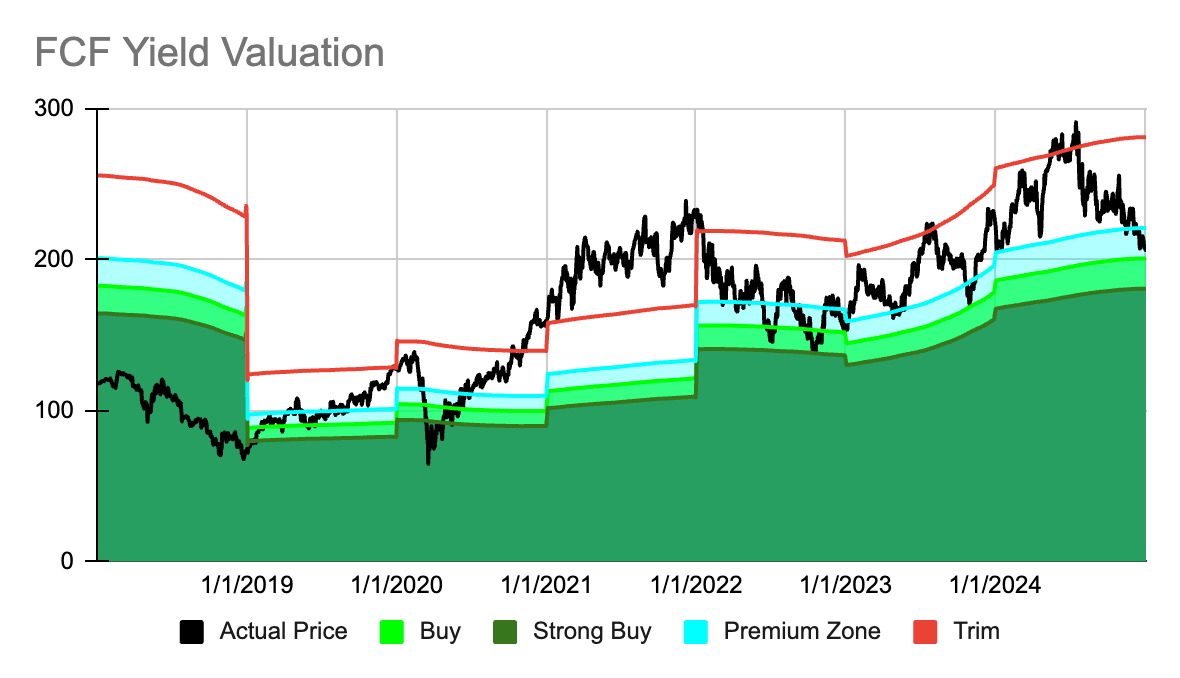
Allegion ALLE 0.00%↑

Allegion stock has been on the downturn lately, declining by 1.38% over the past 5 trading sessions and falling by a little more than 7% over the past month. As a result the stock has been upgraded in my model from a Buy to a Strong Buy. It also sports a pretty attractive forward rate of return of 11.73%.
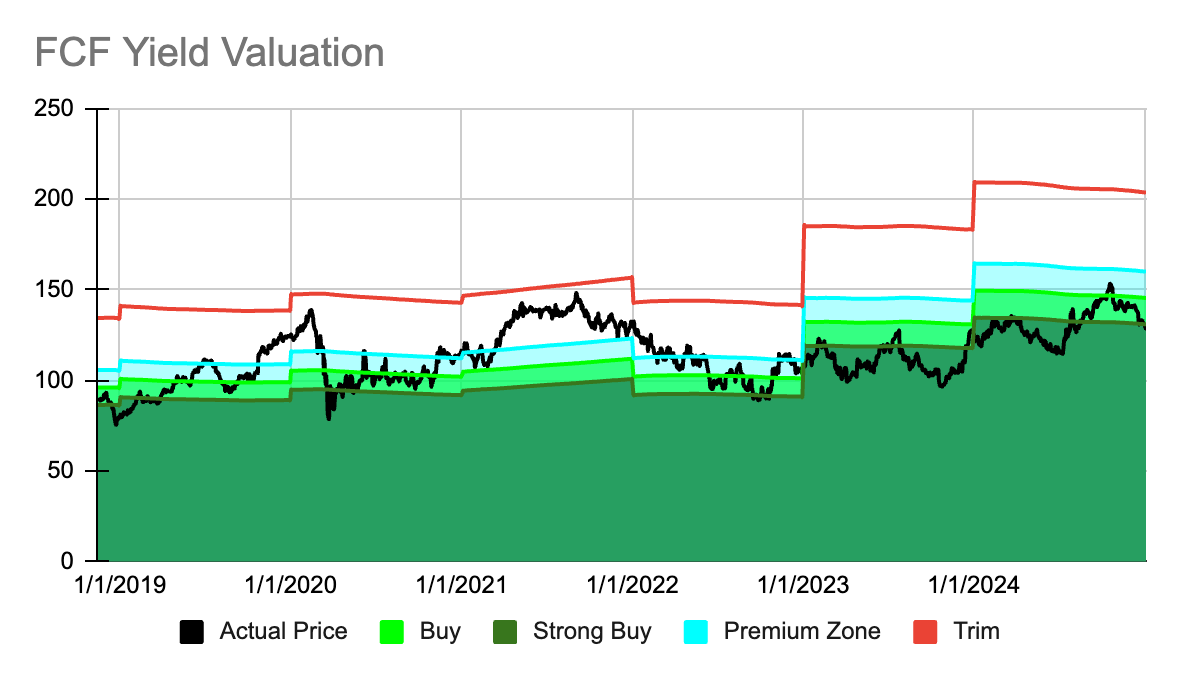
Jack Henry & Associates JKHY 0.00%↑

Jack Henry & Associates stock was flat over the past of trading but did decline by 1.98% over the last 5 sessions. Last weeks decline triggered an upgrade in my valuation model from a Buy to a Strong Buy. The stock also offers a very good forward rate of return of 12.03%.
NXP Semiconductor NXPI 0.00%↑

I just covered NXP Semiconductor last week as the stock traded up from the Buy zone to a Hold zone. Well after a 2.10% drop over the last 5 trading sessions the stock is once again within my model’s Buy range. However the forward expected rate of return of 7.35% is below my ideal threshold of 10%, and therefore this is a cautious Buy rating.
Ferrari RACE 0.00%↑
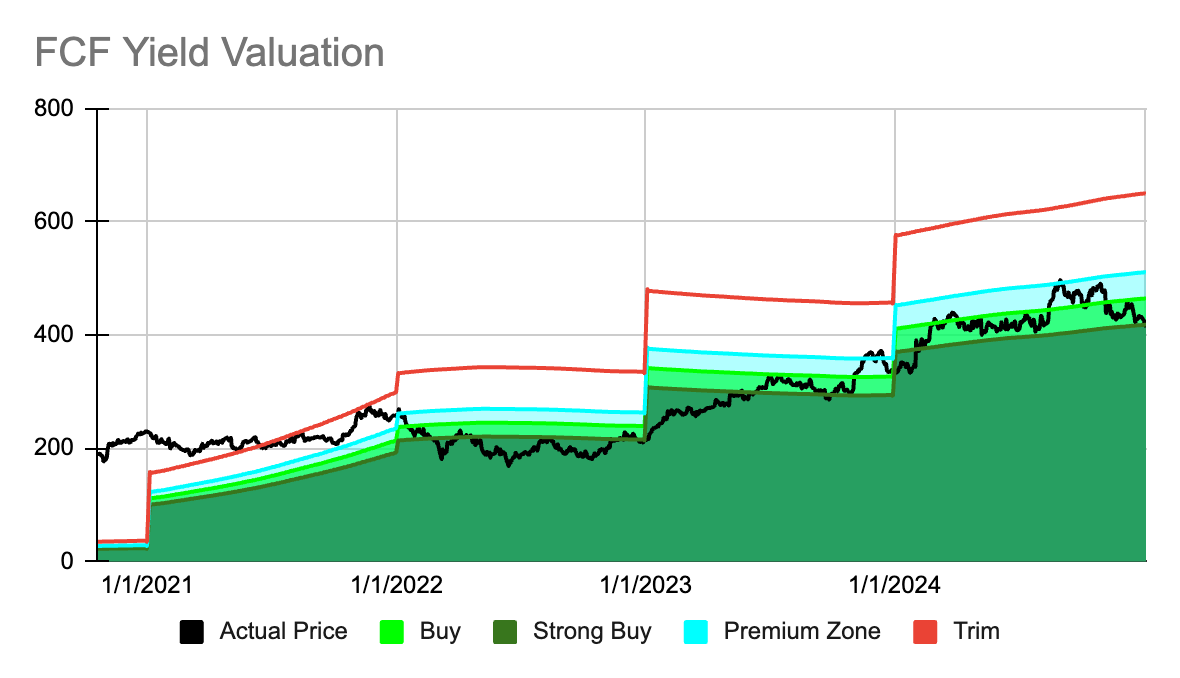
You could say Ferrari stock is racing in the wrong direction, the stock is down 2.86% over the past 5 sessions, 6.31% during the past month and down 2.33% over the last 6 months. The latest downward price push finally brings Ferrari into my Strong Buy zone and the forward expected rate of return just keeps getting more lucrative, currently sitting at 15.27%.


Please note the valuation model is based strictly on quantitative data and therefore does not factor in any qualitative information. As such it is imperative you perform your own due diligence on each stock to ensure there isn’t a valid reason for the valuation change. Lastly, as a reminder all paid subscribers can access live valuation ratings at any time here.
Quality Score Analysis
Last week I shared with you some Quality Score analysis I performed on the Dividend Kings, and the outcome was quite promising.
This week I’d like to share with you the same type of analysis but this time applied to the 50 stocks in the High Quality Investable Universe that this newsletter covers.
For some context, the average quality score for all of the Dividend Kings between 2015 and 2024 was 61.14%. You would assume that my High Quality Investable Universe would on average present a much higher quality score, and it did, 81.35% to be exact. So to an extent the analysis was a little bit different as more stocks qualified to be included in the test portfolios.
The High Quality Investable Universe, on average, also had a much more rewarding total return history.
An equal weight average total return for all 50 stocks in this universe between 2016 and 2024 was +475.96% or a CAGR of 21.48%.
For perspective the S&P 500, as measured by the SPY ETF, had a total return of +240.17% or a CAGR of 14.57%.
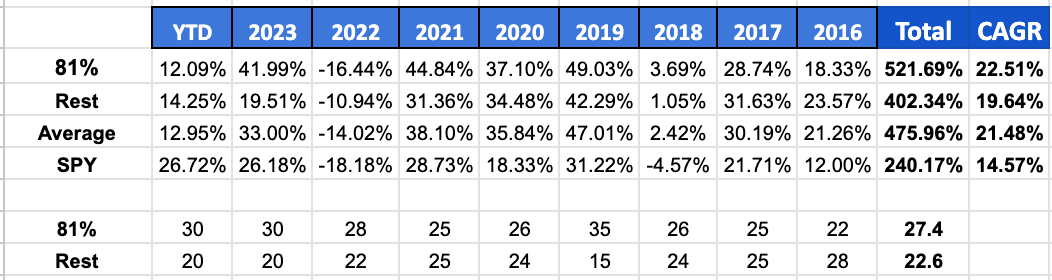
Using a quality score threshold of 81.34%, the average for the test period, the total return improved to +521.69% or a CAGR of 22.51%. At this threshold the test portfolio held between 22 and 35 stocks in any given year, with the average being 27.4.

Pushing the quality score threshold to 90% only gave a marginal improvement to the total return, pushing it up to +533.12% or a CAGR of 22.76%. This threshold also concentrated the portfolio with about 10 fewer holdings per year on average.

The threshold would have to be pushed up to 97% to see another marginal gain with a total return of +547.56% or a CAGR of 23.07%. This threshold decreased the average number of holdings down to just 7.3 on average per year.
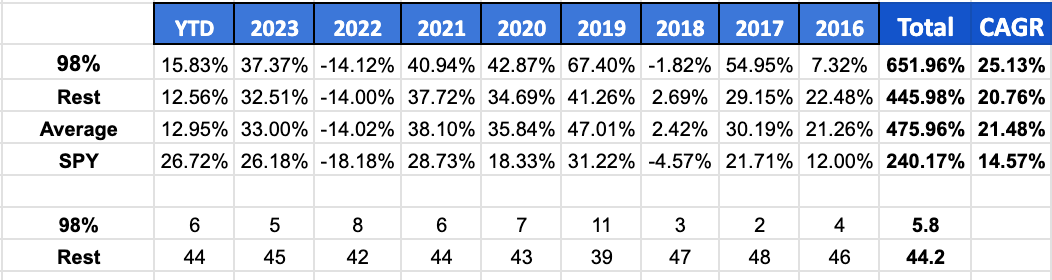
At a threshold of 98% the total return ticked up quite a bit, up to +651.96% or a CAGR of 25.13%. While the number of chosen stocks declined by about 1.5 less per year on average.
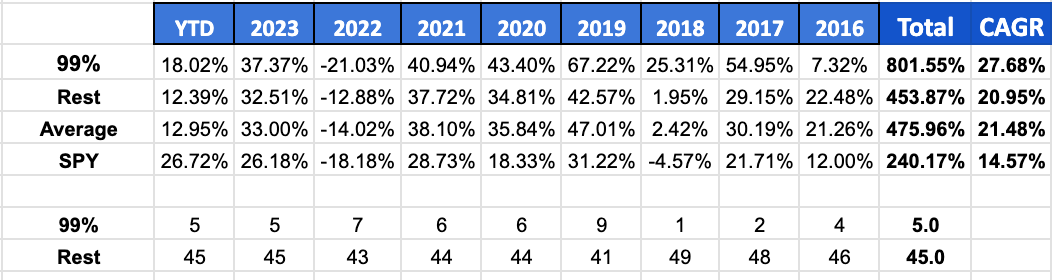
At a threshold of 99% the average number of holdings declined by 0.8 but the total return improved significantly, up to +801.55% or a CAGR of 27.68%

And kicking the threshold up as much as I could, up to 99.9%, gave another marginal improvement with the total return climbing to +830.91% and a CAGR of 28.13%. With the average number of holdings again declining by 0.8 per year on average.
This test was a different relative to testing the quality score with the Dividend Kings, in the sense that on average these 50 stocks already crushed the average market return.
While the overall outcome still bodes well for the application of the quality score, it was really the best of the best that provided a significant improvement in total alpha.
What I have not tested yet, but am working on already, is the inclusion of a valuation factor. I think the first test will be purely valuation based and then I will try to combine the quality score with the valuation. What I want to see is how effective the valuation model is on its own and further if using the quality score with the valuation model has merit. The results of those tests will be shared in future updates.
Another project that is in the works is testing the quality score on a more broad universe of stocks. This test will include over 650 dividend growth stocks and in the long run it will be used to reshape the investable universe. The plan is to design a long-term platform for selecting the best dividend growth stocks to achieve a market beating total return.