
Quality Portfolio - Data Analysis Part 1
A little Monday morning quarterback!
📊 Quality Funnel Follow-Up: What the Data Says
Last week, I introduced the Quality Funnel a set of simple filters that significantly trim the fat from the investable universe. This week, we’re diving into the 171 stocks that passed that initial screen.
We’re going to play a little Monday Morning Quarterback, looking back and asking: Did these quality filters actually lead to better long-term returns?
Let’s find out.
And don’t worry you’ll find a link to download the full spreadsheet with all the data at the end of the post.
🔍 High-Level Dataset Summary
Before we dive into correlations and insights, here’s a quick look at the key stats across the 171 high quality stocks:
Dividend Yield
Average: 1.86%
Median: 1.45%
Range: 0.03% – 7.50%
Payout Ratio
Average: 39.1%
Median: 34.5%
Range: 1.3% – 88.8%
Dividend Growth (3-Year / 5-Year)
3Y Avg: 11.4%, Median: 8.8%
5Y Avg: 10.5%, Median: 8.5%
Revenue Growth (3-Year / 5-Year)
3Y Avg: 9.1%, Median: 7.5%
5Y Avg: 8.4%, Median: 6.7%
EPS Growth (3-Year / 5-Year)
3Y Avg: 14.9%, Median: 11.1%
5Y Avg: 14.4%, Median: 11.0%
Return on Invested Capital (ROIC)
Average: 16.0%
Median: 12.4%
Morningstar Ratings
Economic Moat: 81 Wide, 90 Narrow
Management: 72 Exemplary, 99 Standard
Cumulative Return (Jan 2020 – May 2025)
Average: 118.7%
Median: 83.6%
Range: -56.9% to +2,206.8%
📈 Do Better Fundamentals Drive Better Returns?
Let’s test whether better-than-average or better-than-median fundamentals correlate with stronger cumulative returns.
➕ Scoring Methodology
Each stock earned 1 point for exceeding the average (or median) in any of the 11 fundamental categories.
+1 for a Wide Moat.
+1 for Exemplary Management.
🔹 Better Than Average (Score vs. Return)
Avg Score: 4.44
Avg Return: 118.67%

🔹 Better Than Median (Score vs. Return)
Avg Score: 5.35
Median Return: 83.64%
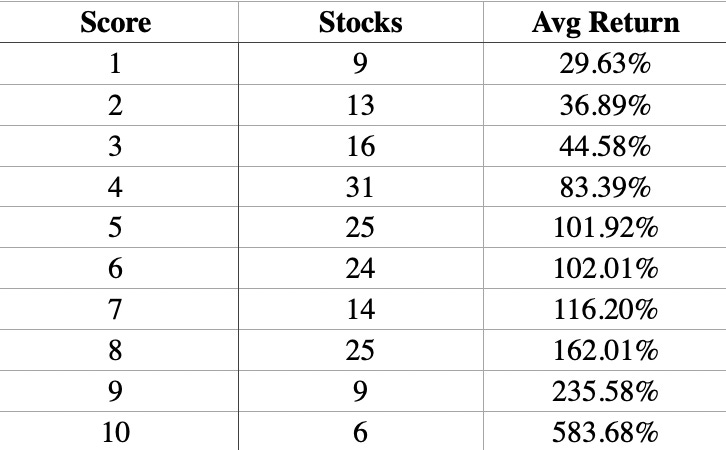
Conclusion: The more quality points a stock had, the stronger its return — clear and consistent across both average and median comparisons.
⚠️ Metrics That Didn’t Add Much Value
While most quality metrics correlated with stronger returns, a few didn’t hold much weight:
Dividend Yield
Inversely correlated — lower yielders often outperformed higher-yielding stocks.Payout Ratio
Lower ratios correlated with stronger returns, but largely due to their connection with lower-yielding, faster-growing companies.Dividend Growth Rate
Though correlated with returns, the causation likely flows the other way: companies growing earnings can afford to raise dividends.
✅ Metrics That Mattered
🌊 Economic Moat
Wide Moat (81 stocks): Avg Return 140.6%
Narrow Moat (90 stocks): Avg Return 98.9%
👨💼 Management Rating
Exemplary (72 stocks): Avg Return 141.4%
Standard (99 stocks): Avg Return 102.1%
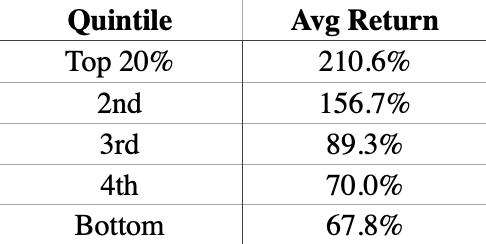
📈 Revenue Growth
3-Year Revenue Growth Quintiles:
5-Year Revenue Growth Quintiles:

💵 Earnings Per Share (EPS) Growth
3-Year EPS Growth Quintiles:
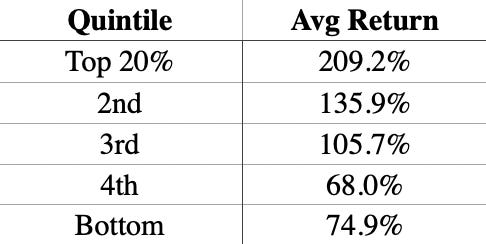
5-Year EPS Growth Quintiles:

🏗️ Return on Invested Capital (ROIC)

🧠 Key Takeaways
This is confirmation of what we intuitively believe:
Companies that grow faster in revenue, earnings, and capital efficiency tend to generate higher returns.
Historical analysis like this can’t predict which companies will continue to grow. But it does point to the value of focusing on companies that have already demonstrated consistent, durable growth.
That’s what this strategy is all about:
Find great businesses
Wait for fair value
Hold for the long term
🧭 Next Steps
From here, I’ll begin:
Tightening the filters to further refine the investable universe
Reviewing each company briefly
Building an automated valuation model
Constructing and launching the Quality Portfolio
Our goal?
12%+ long-term CAGR
with a growing dividend income stream — the natural by-product of investing in great businesses.
📂 Download the Dataset
You can access the full Excel file used for this analysis here:
Once the methodology is ironed out, how do you plan to invest? Will you make a lump sum investment in your top picks, or add monthly to an updated list, etc.? Looking forward to following along!
Perfect article. One question. Where does one look for ratings of management?