3 Things We’ll Cover today
I’ll show you more data from backtesting the model strategies
I’ll share the final parameters of the investable universe
We’ll look at sample model portfolios from this past weekend
Before we jump in just a quick note about why this week’s newsletter is being sent on Tuesday rather than Thursday. Tomorrow, Tuesday April 16th, I will be at the hospital welcoming my baby daughter into this world. I debated about skipping this week’s newsletter but since I had some time this past weekend and put some more work in on this project I figured I might as well share that data with you.
Full Backtest Results for Model Strategy #7
You’ve seen the performance results of all of the model strategies but you have yet to see the actual stocks that were selected for inclusion in each model portfolio. To be honest I personally haven’t even focused too much on which stocks were selected in specific years. The selections were interesting to see. What I find most unique is that I personally would likely not invest in some of these companies outside of a rules based approach. Many of these companies are either not on my radar or I simply don’t understand the industry/company too well. That being said there were plenty of familiar names that made the cut each year as well.
Here’s a snapshot of the stocks that were chosen each year for model strategy #7.
The year in the first row is associated with the selection data and the chosen 20 stocks are identified for the following year. For example, column one is based on 2018 data and the chosen 20 stocks were held in the model portfolio during calendar year 2019. Column 2 shows the total return for each stock in 2019, and so forth.
Summarized at the bottom are the average returns for each year for the top 20 chosen stocks, all stocks in the tested investable universe (111 stocks), and the S&P 500.
The final row shows the annual turnover in the portfolio which was quite high, about 50-60% turnover from year to year. This would likely have a pretty significant impact in taxable brokerage accounts and it would erode a chunk of the alpha.
Perhaps that is something I can compute in the future.
Investable Universe
One of the open questions from Part 3 of this series was the investable universe this model strategy will be applied to. If you recall I had to clean up the test universe to remove companies that had missing data and also companies that were not consistent dividend payers. Manually adjusting the investable universe is not ideal, and it defeats the objective of this being a completely rules based investing strategy. The ultimate goal is for this strategy to run on autopilot, with all the decisions based on concrete rules from start to finish.
This past weekend I refined the finchat.io screener to hopefully address some of these shortcomings.
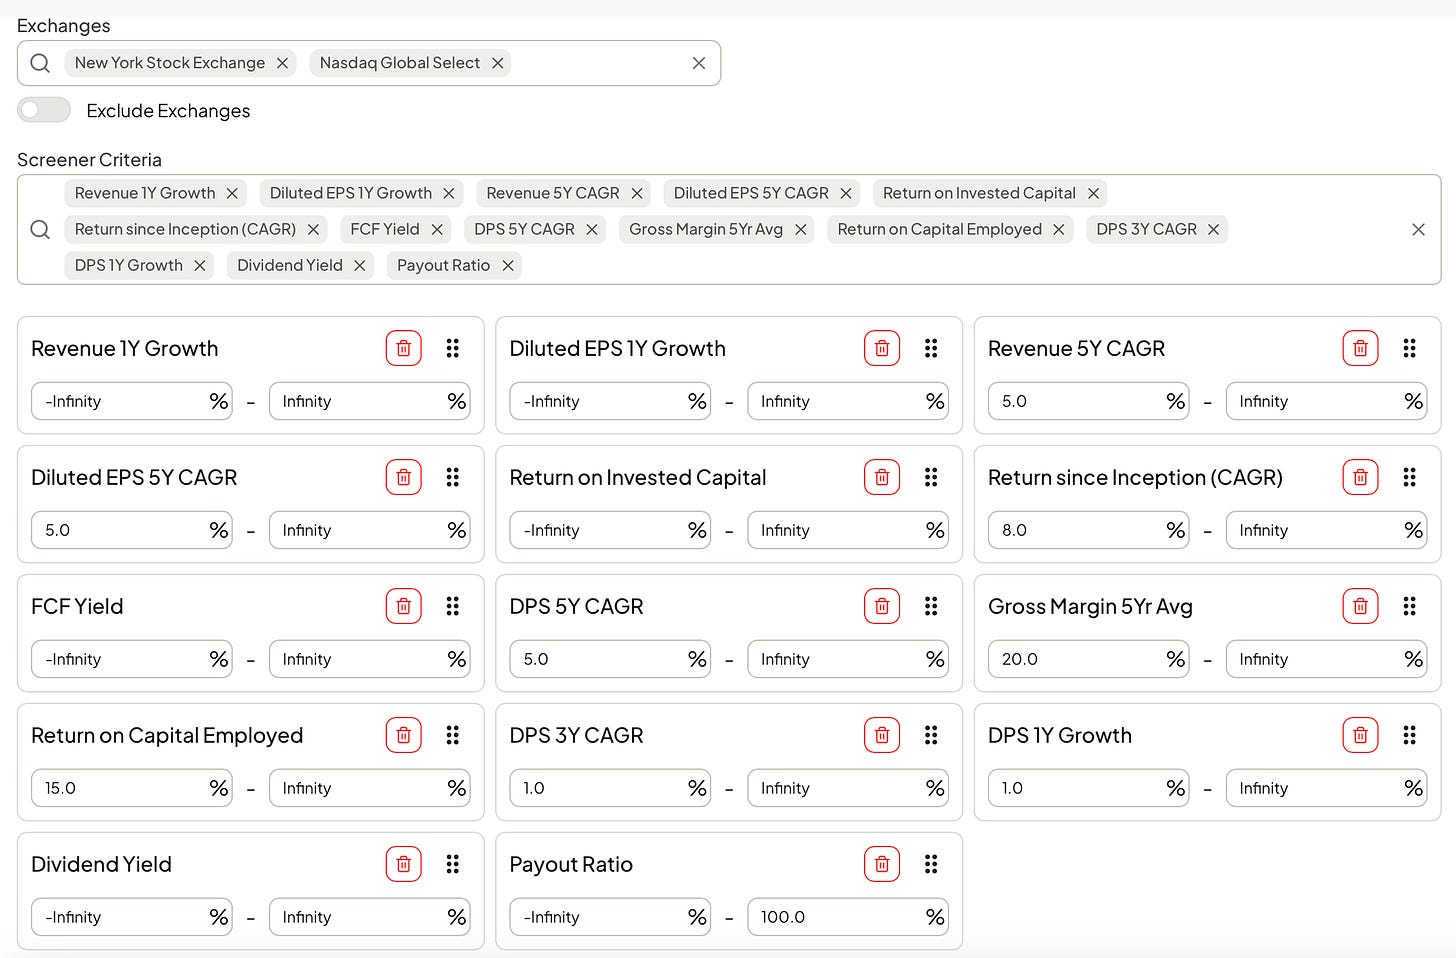
Here is exactly how I setup the screener that will be used to create the first actual portfolio for this strategy.
As you can see I am filtering for 8 conditions as well as limiting the pool of stocks to just those that trade on the NYSE and the NASDAQ. The additional 6 data points are all included to collect data to be used in the stock selection process or for informational purposes.
To weed out inconsistent dividend payers I’ve added the 1 and 3 year dividend growth rates that in both cases I expect to be at least 1%. While that isn’t an appealing rate of dividend growth, the intention is more so to eliminate stocks that cut their dividend and stocks that aren’t consistent dividend growers.
I ran this screener this past weekend and it generated an investable universe of 98 companies. I think that is a pretty good sized universe for this strategy.
Sample Model Portfolios
After I ran this screener on Saturday, I decided to mock up the model portfolio to see which 20 stocks would have been included had I launched this portfolio on Monday April 15th. It’s highly likely that many of the same stocks will be included in the actual portfolio that will be funded on May 1st. This data may not change too much in the next 15 days so this is a good preview for the upcoming portfolio reveal.
I mocked up both model #7 and model #10, these models generated the best overall returns in the backtest. I have not decided which model will be chosen for the actual strategy, although I am still leaning more towards model #7. You can refer to part 3 of this series to see the exact strategy of each model.
Perhaps you can let me know whether you like one over the other.
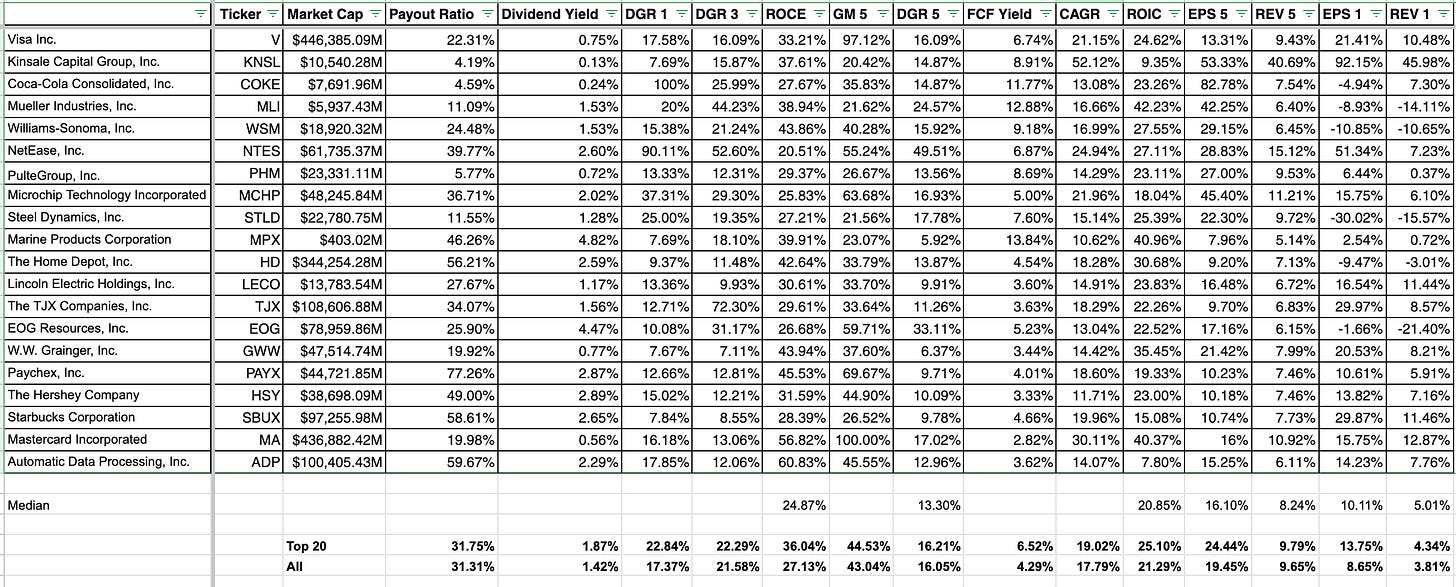
Here are the top 20 stocks selected for Model #7.
At the bottom of the image you can see the average statistics for the top 20 stocks compared to the investable universe as a whole.
The model portfolio offers a slightly more attractive yield of 1.87% relative to 1.42% for the universe. The top 20 stocks have more favorable metrics (on average) than the universe across the board with the exception of a slightly higher payout ratio.
Here are the top 20 stocks selected for Model #10.
Model #10 offers a slightly higher dividend yield of 1.9% and largely is very similar to model #7. There are 3 unique stocks that were selected by each strategy.
Here are the unique holdings.
Model #7 includes: Paychex, Hershey and ADP
While Model #10 includes: AGCO, Allegion and Dick’s.
The 85% overlap in allocation most likely will mean that both strategies would generate very similar returns, unless of course the unique stocks either see very favorable or very poor results in the coming 12 months.
Next
I’ll have my final decision on which model will be adopted by next week and then on April 30th (evening) I will let you know which 20 stocks will be included in the actual test portfolio that will be funded on May 1st. I will invest about $8,000 into this strategy in a tax exempt account. The chosen stocks will be held for a duration of 12 months with no rebalancing.
The goal is for this strategy to:
generate long-term alpha to the S&P 500
generate long-term alpha to the investable universe
evaluation period will be at least 5 years
I do not recommend this strategy to anyone. I have considered the risk of investing my capital into this strategy and I am prepared to bear the losses and any opportunity cost. It is highly likely that this strategy may underperform the market as a whole. My best guess would be that it will lose at least in 2 out of 6 years to the S&P 500. I’m optimistic that the strategy has the potential to deliver long-term alpha and I look forward to finding out.


Recently followed you from Seeking Alpha to YouTube, and now here. Appreciate your detailed approach and transparency. Look forward to tracking this portfolio experiment. Also, congrats on the new addition to your family