Start With The Dividend Aristocrats
Late, one rainy evening on December 28th, 1989 four men met secretly in the basement of a Wall Street bank. The purpose of this meeting was to come up with an elusive list of the greatest dividend stocks. Today we call this list the S&P 500 dividend aristocrats. Well, that’s not exactly how the dividend aristocrats came about but I like to think there was some secret meeting that brought this list of elite dividend stocks into existence.
The actual dividend aristocrat index was launched in May of 2005 by S&P Global. And the real objective was to track the performance of companies that committed to paying and increasing dividends for a very long time, at least 25 years to be exact. Historical data was used to document the hypothetical performance of the index going back to 1990 (December 29th 1989 to be exact).
Since inception the dividend aristocrats have generated a higher rate of return than the S&P 500 index while exposing investors to lower volatility, culminating in a favorable risk-adjusted return. The dividend aristocrats have not outperformed the S&P 500 index every calendar year and they tend to generate significant alpha when the market is declining.
The additional benefit of investing in the dividend aristocrats is the dividend income of course. The index has on average offered a dividend yield of at least 0.5-1% higher than the S&P 500 and much more consistent dividend growth.
It’s important to note that the index does experience a lot of turnover. In the past 15 years there have been more than 70 changes to the composition of the list, inclusive of companies dropping out and new businesses joining. Despite the high turnover, often times due to dividend cuts, the dividend aristocrat index has a rather respectable track record.
Hence if you’re a dividend focused investor its makes perfect sense to at the very least start your journey with a few of these elusive companies in your portfolio.
Today there are 66 dividend aristocrats, some that have met the criteria to be on the list twice over. But not all of the current aristocrats are great stocks to own. What I’d like to do is share with you the current valuation and recent dividend history for all the aristocrats to potentially help you find a few that could earn a spot in your portfolio.
Please note that the following valuations are all based on estimates and assumptions and further due diligence is necessary before you make any investing decisions.
Without further ado, here are all the aristocrats in alphabetical order.
*Amcor and Kenvue are excluded due to lack of historical data to perform the valuation.
Abbvie (ABBV)
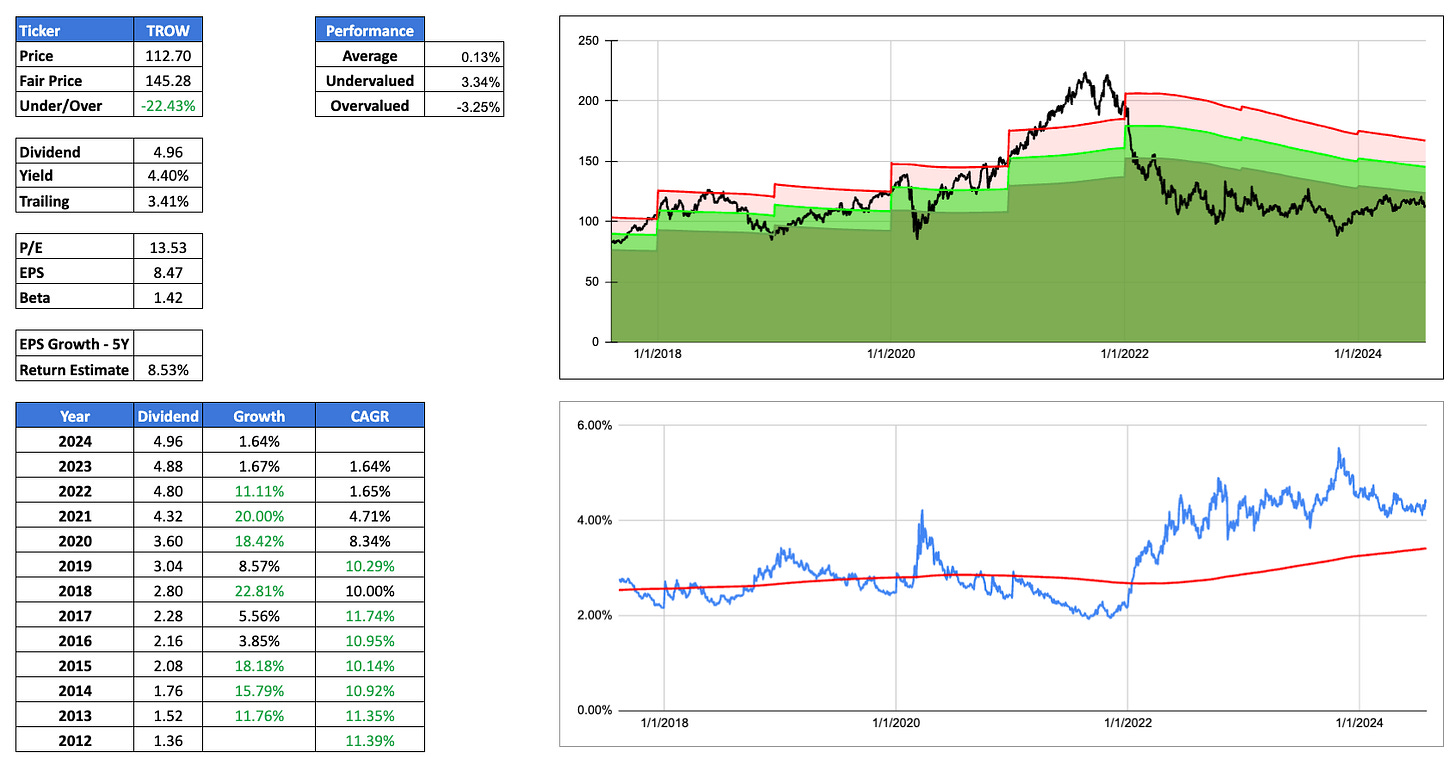
How to interpret the data.
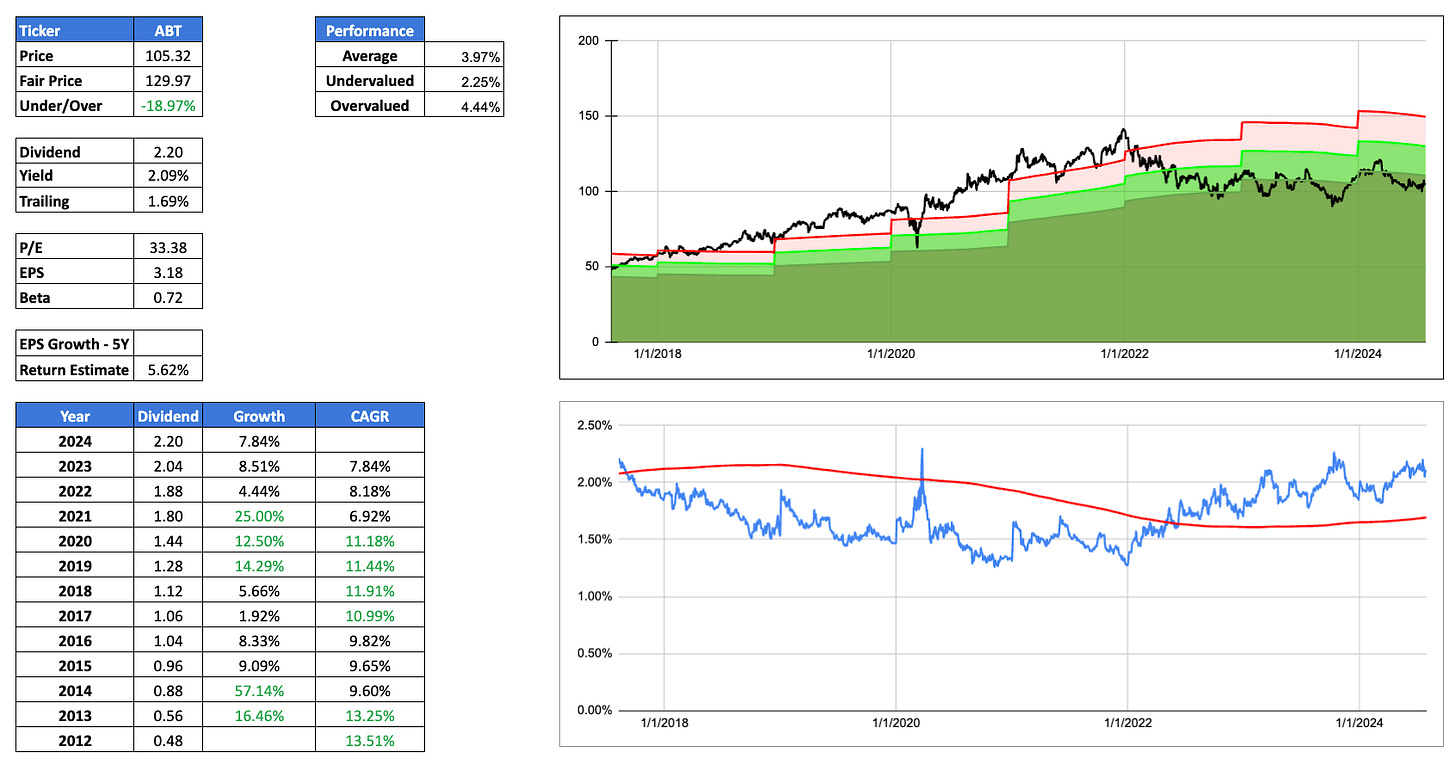
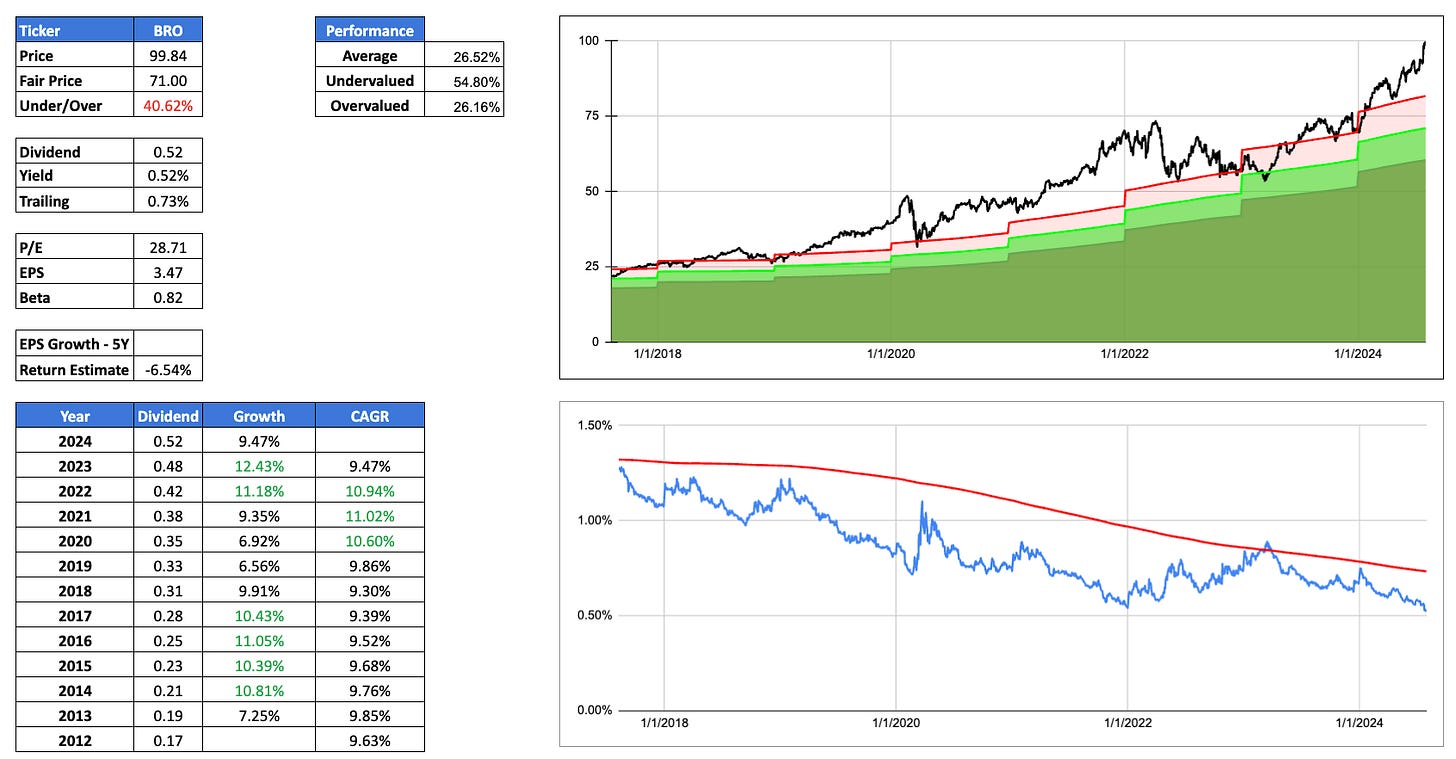
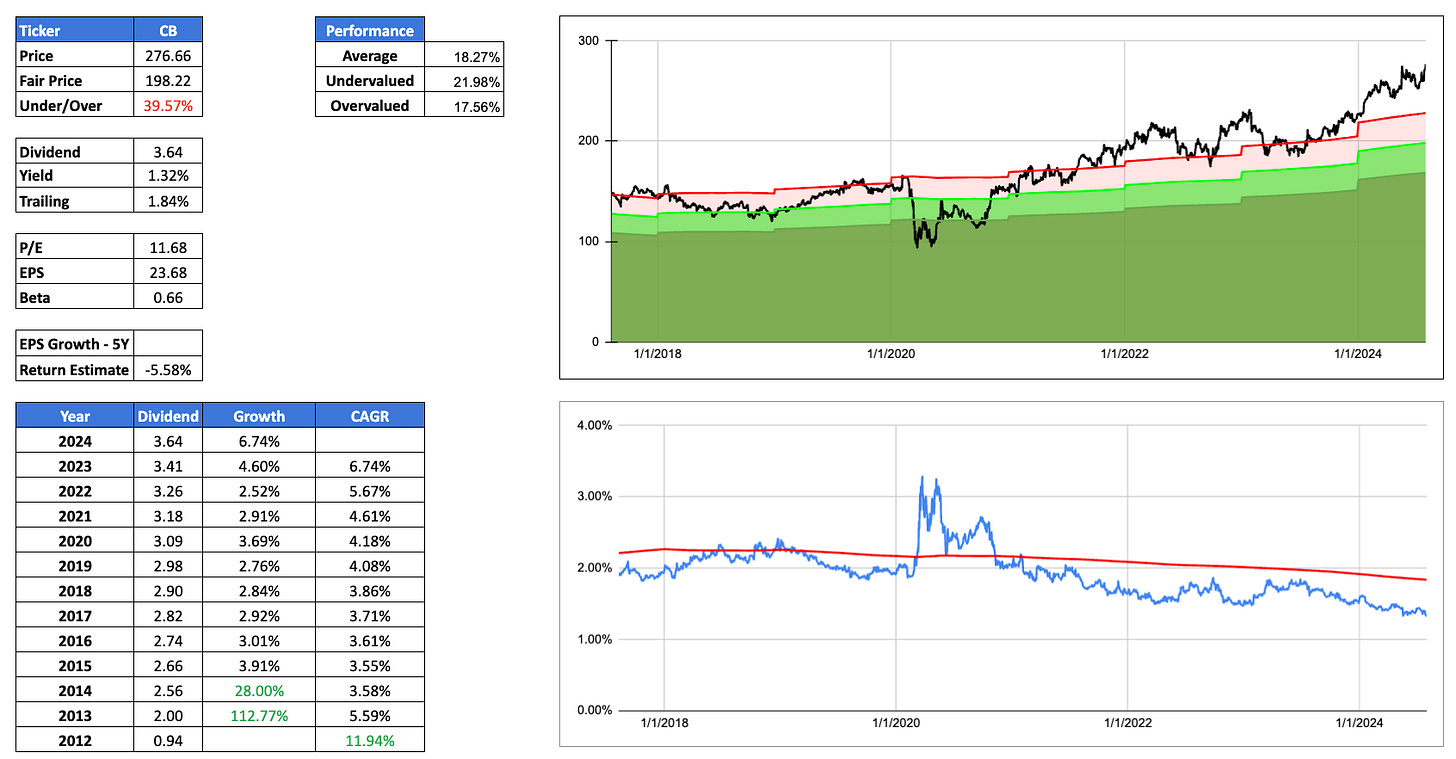
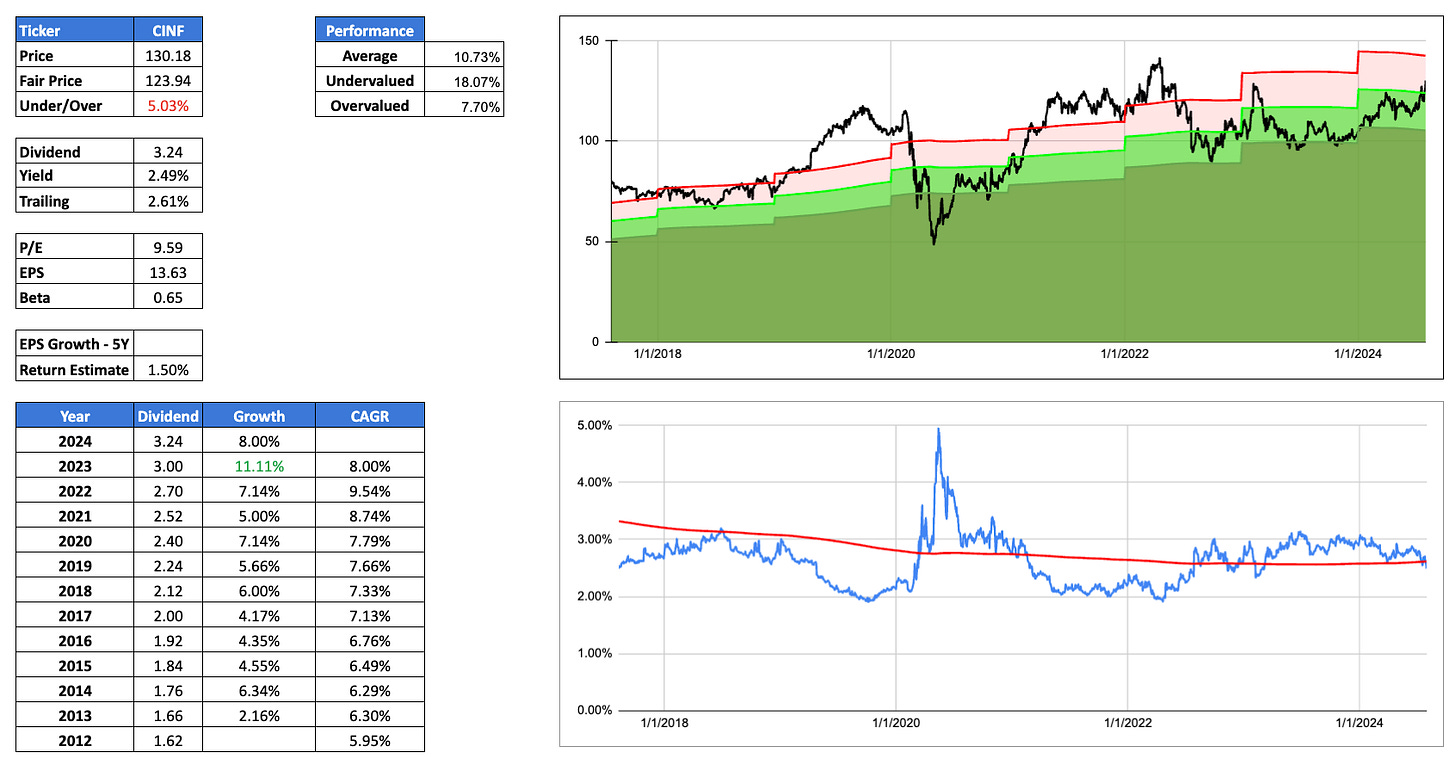
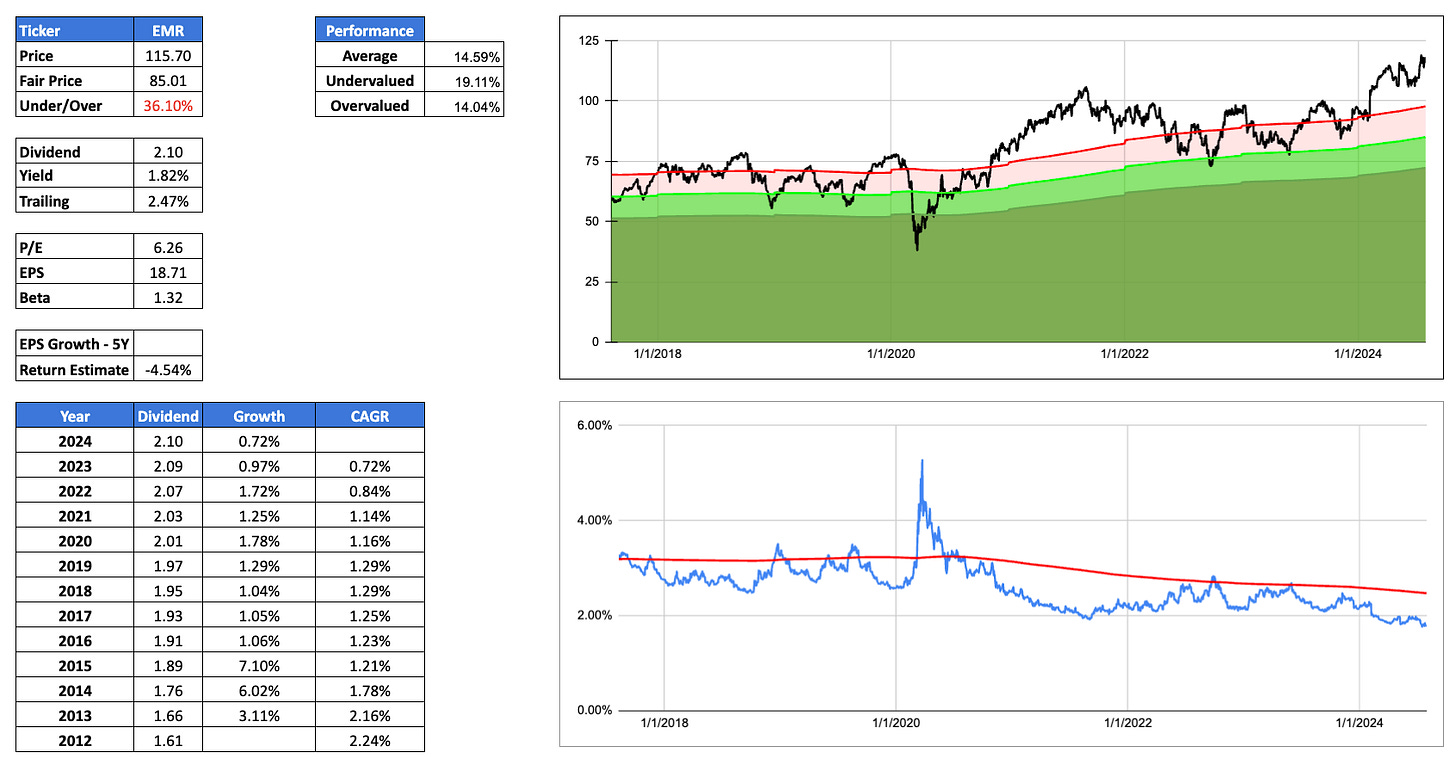
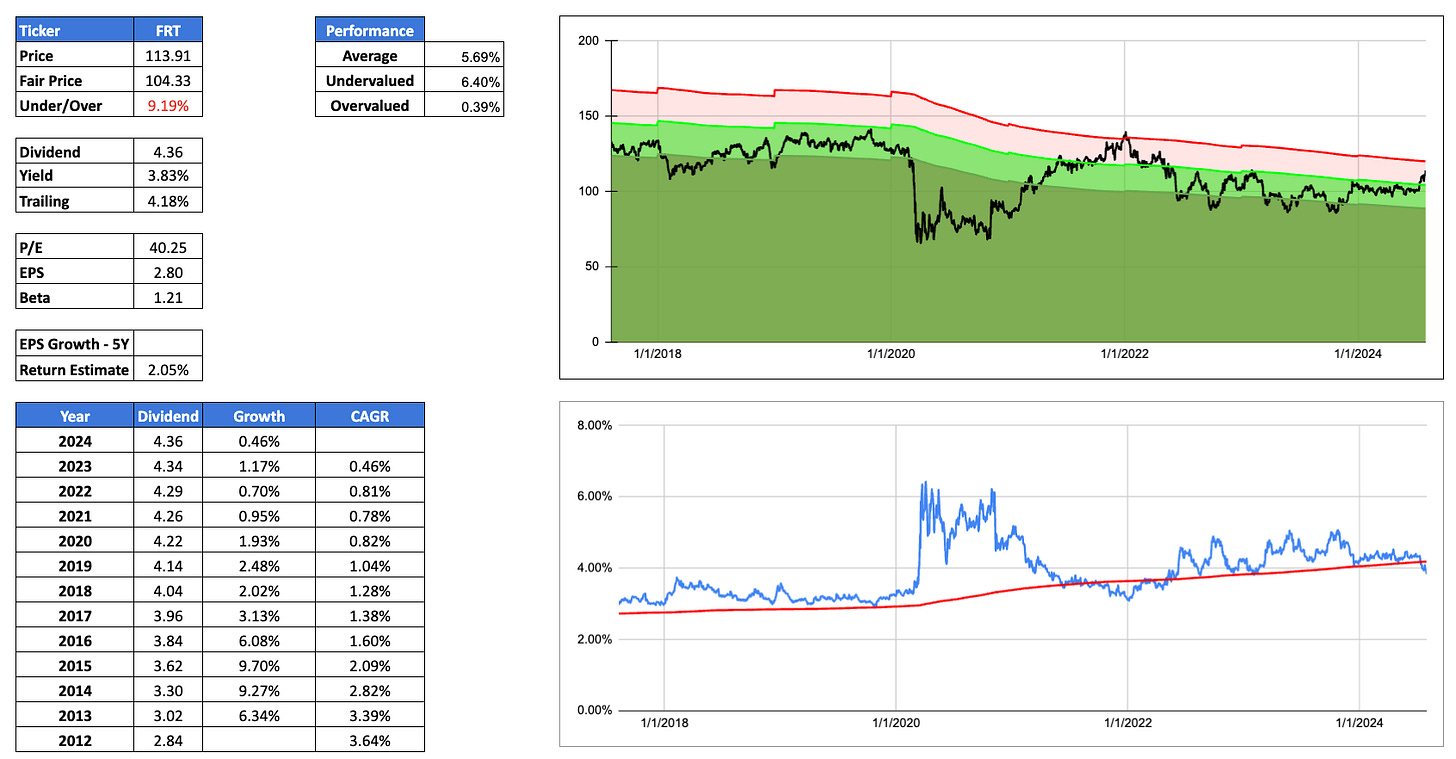
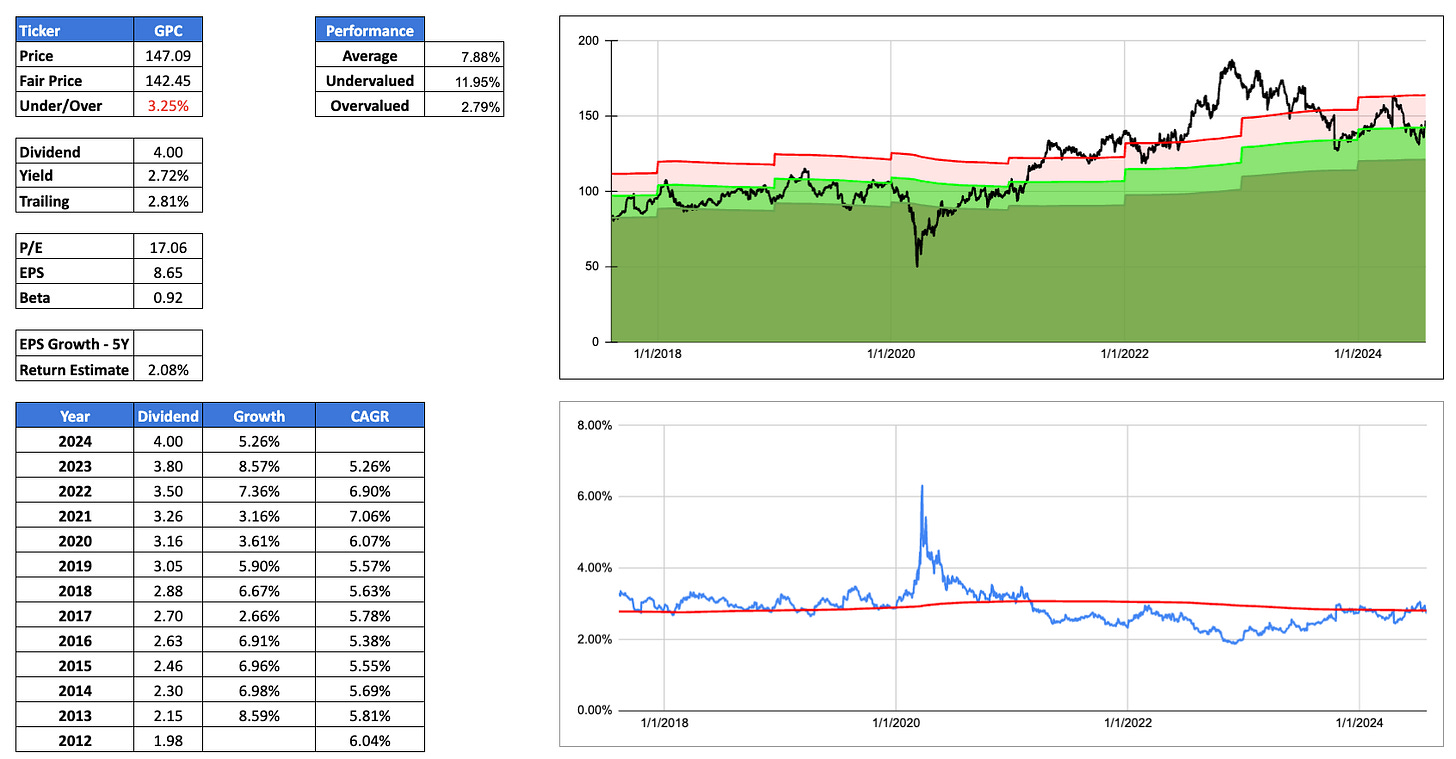
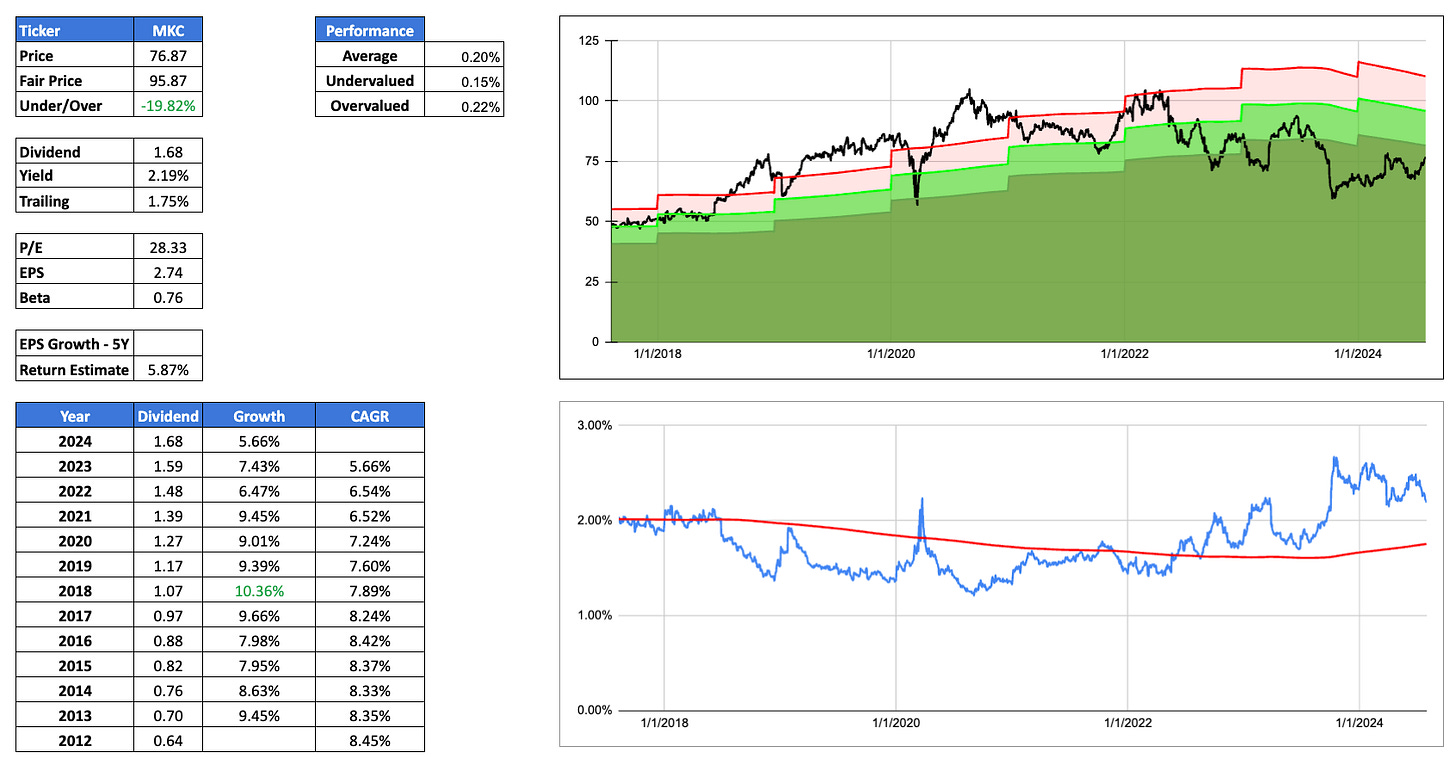
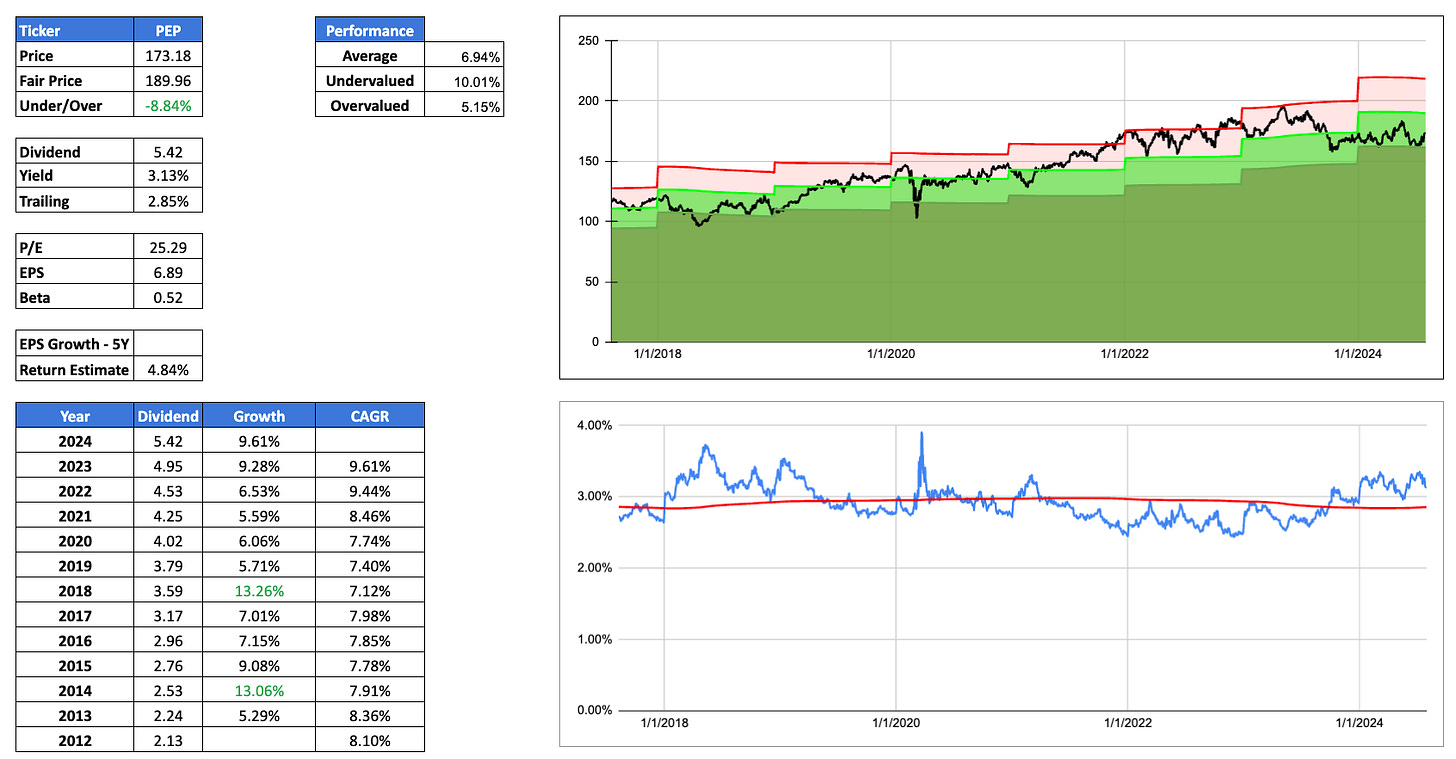
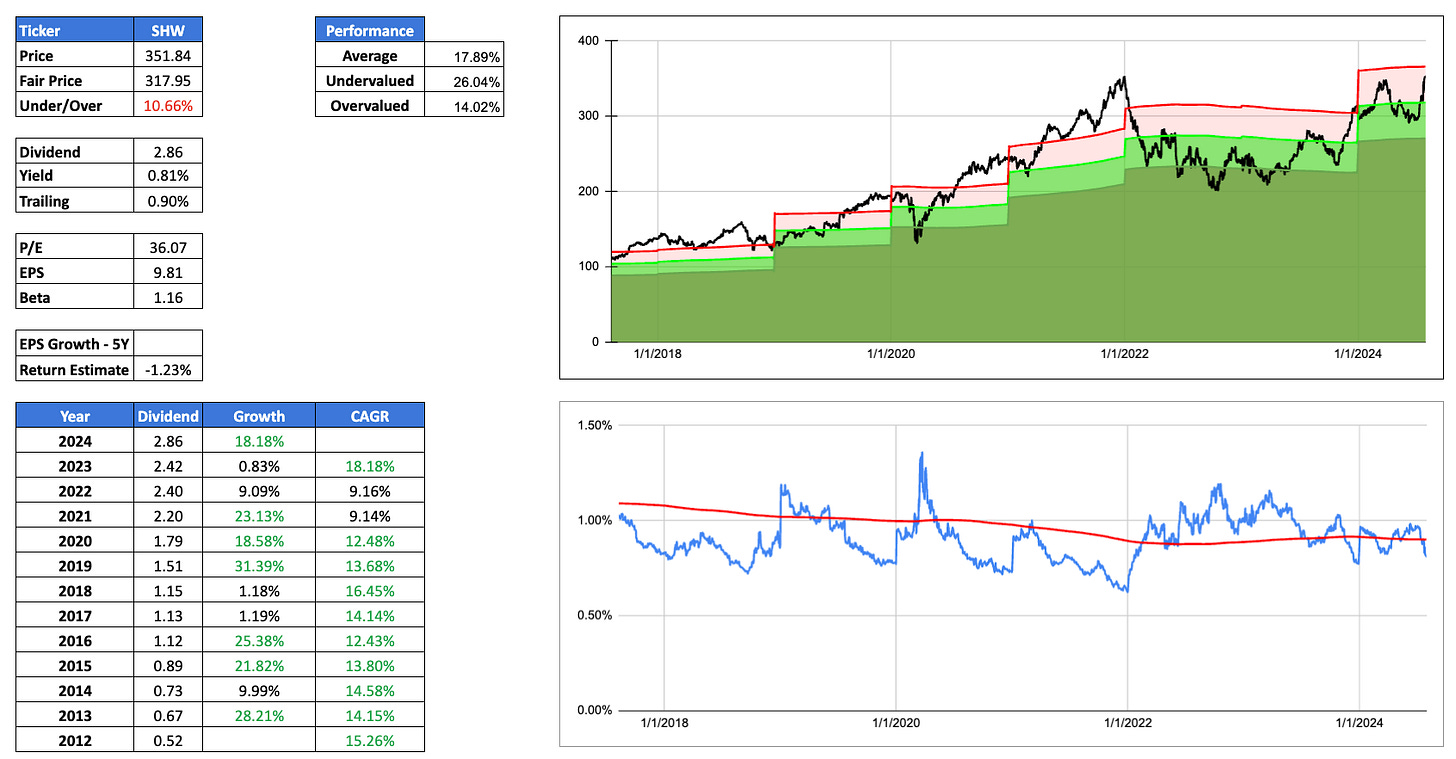
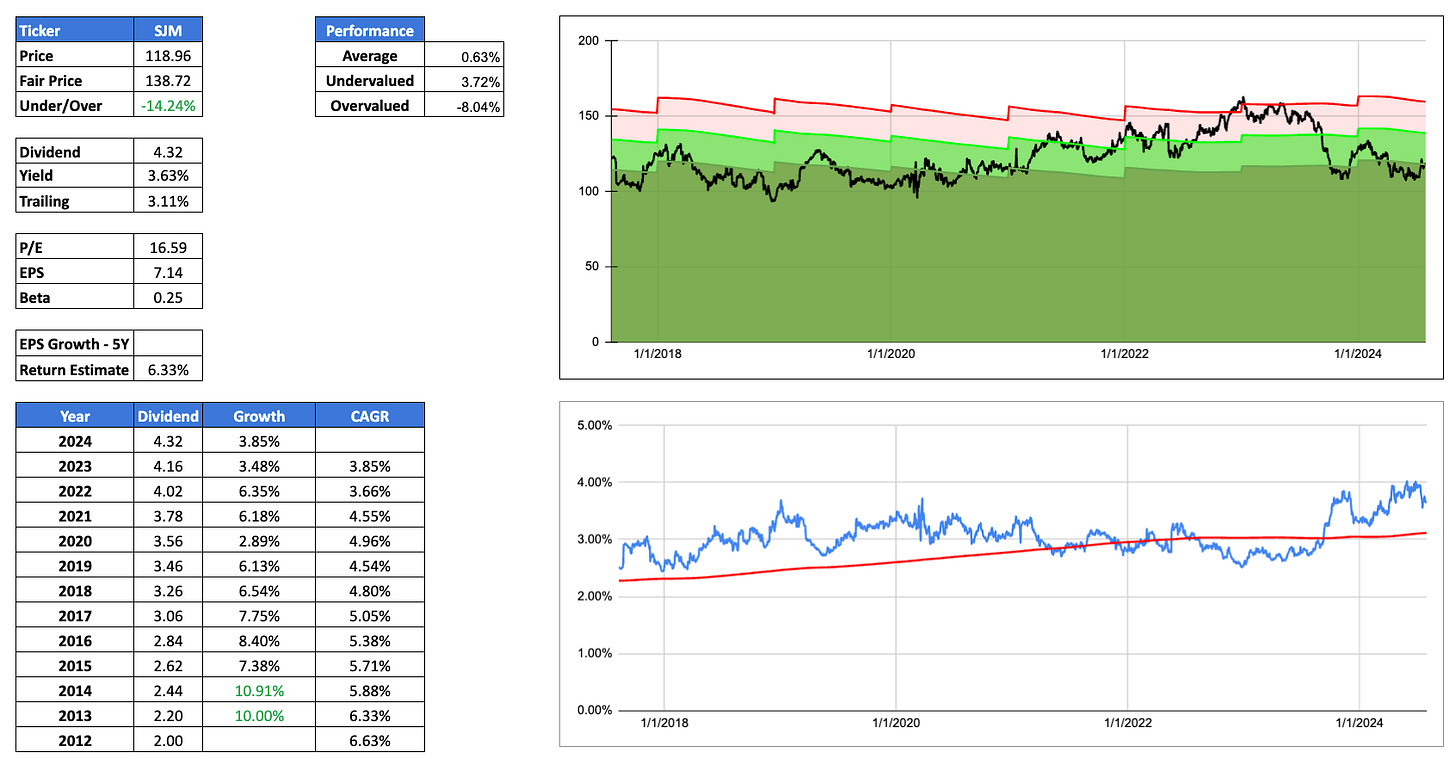
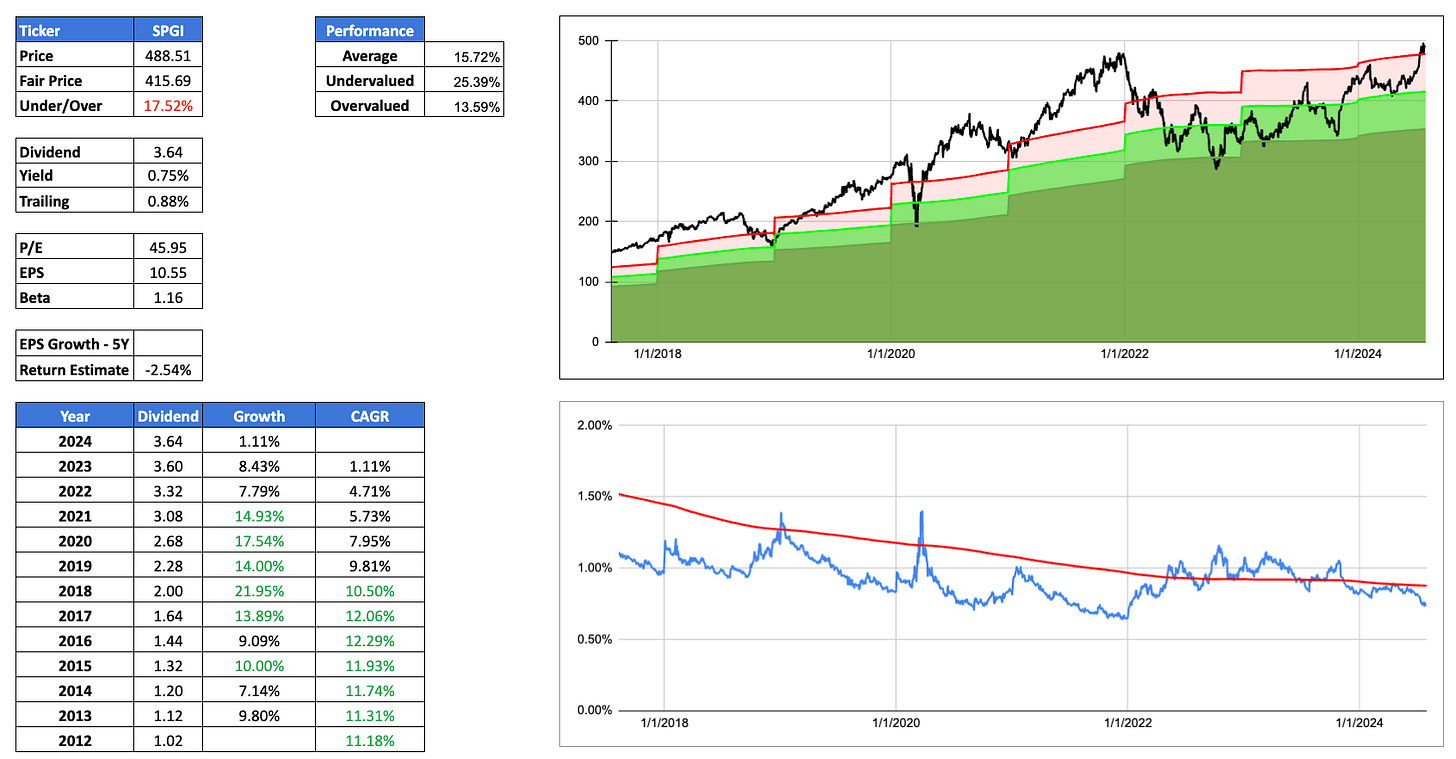
Table on the top left shows the current price, the fair price as a function of the trailing dividend yield and the potential over/undervaluation (red is over valuation / green is undervaluation).
Chart on top right shows the historical valuation for the last 7 years with the light green area representing fair value to a 15% discount. The dark green area starts at a 15% discount while the red area shows spans from fair value to a 15% premium.
The chart on the bottom right shows the historical dividend yield (blue line) juxtaposed with the rolling 5 year average dividend yield (red line).
Table on lower left shows the dividend history for the past decade.


