Quality Dividend Stock: Johnson & Johnson (JNJ)
1. Company
Johnson & Johnson needs no introduction, whether you’re a seasoned investor or not you likely know this company and use their products. If you think that you do not let me name a few. Medicines such as Benadryl, Motrin or Tylenol. Consumer products such as BAND-AID, Johnson’s Baby, Listerine, Neosporin and Rogaine.
What you may not know about this company is that it was founded in 1886. It went public in 1944 and has grown by nearly 5,000% since 1990.
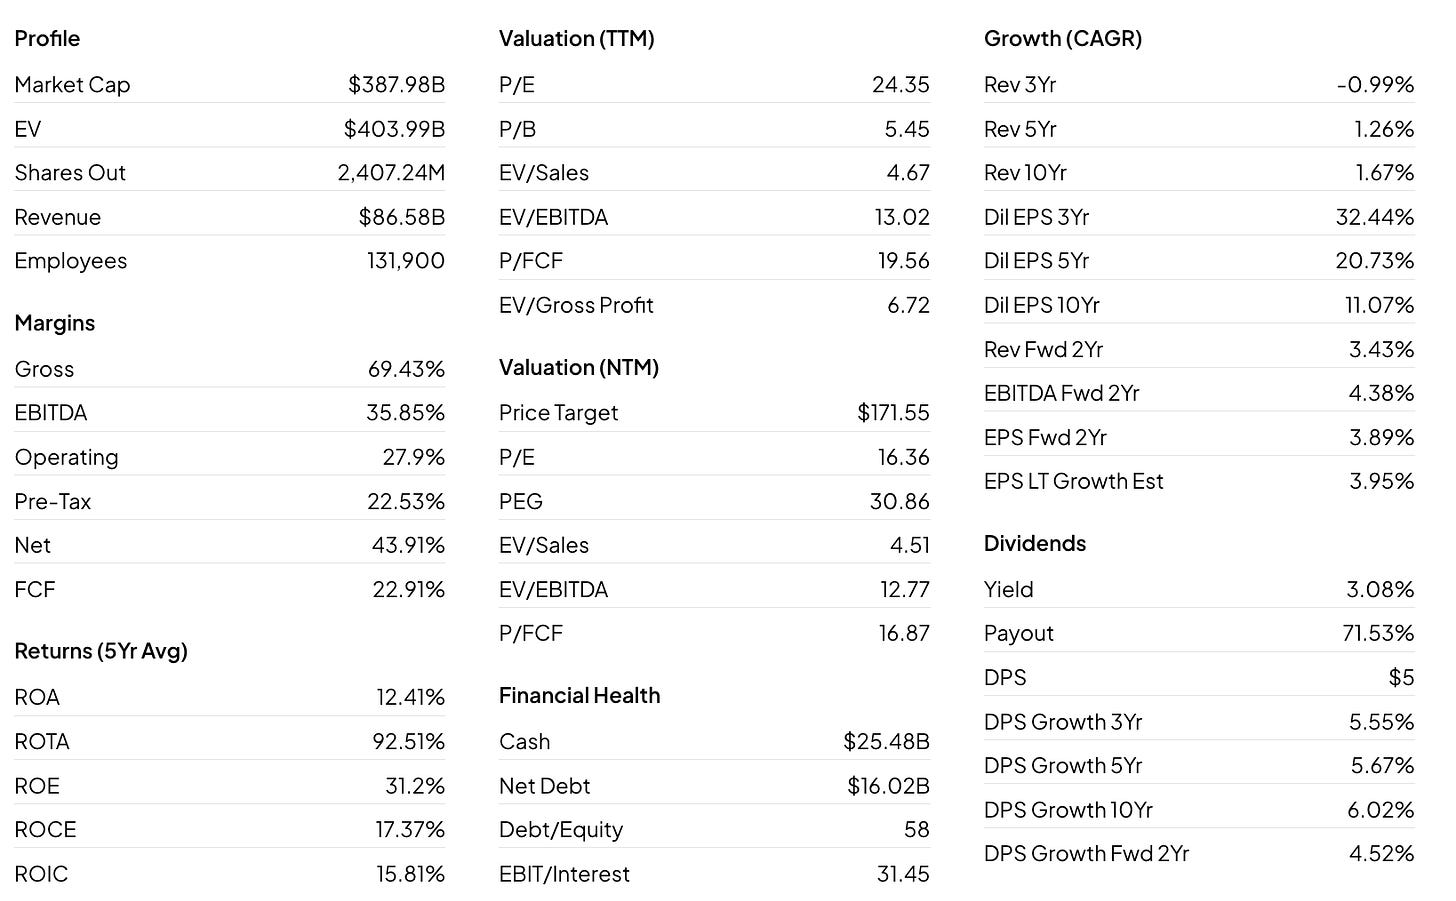
Here is a snapshot of some high level financial metrics.
2. Is It A Winner?
The best kind of high quality company is one that is already a winner and the best way to determine if a company is a “winner” is to look at its long-term track record. As the chart below shows us JNJ has grown by over 4,700% since 1990 or a CAGR of 11.8%
That’s a pretty good track record in my opinion, given that the market, on average, grows at about 10%.
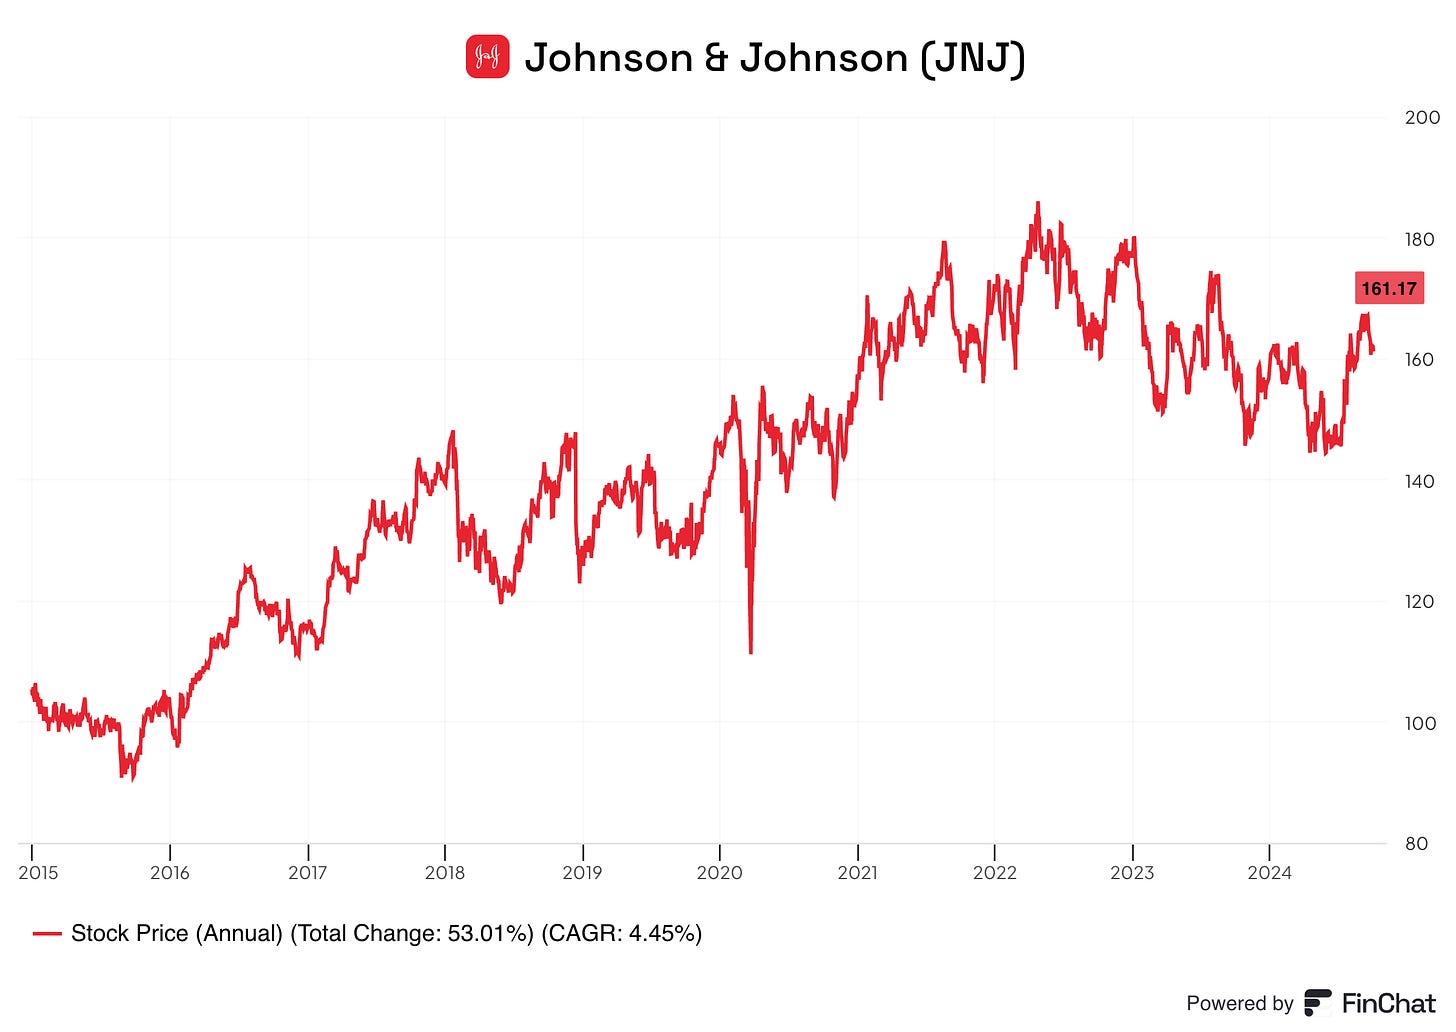
More recently though this solid pace of growth has slowed, as shown in the 10 year chart below. You’ll notice the CAGR of 4.45% is not overly attractive. The stagnation in the share price is primarily attributable to the TALC lawsuit the company is currently dealing with. I won’t get into the details as that is beyond the scope of this review, but I would encourage any shareholders or those interested in initiating a position to dig deeper into this issue.
3. Dividend Data
Since we are looking for a quality Dividend stock it only makes sense that we consider the company’s dividend history.
JNJ has grown its dividend at a very steady pace, averaging 5.55% during the past 3 years, 5.67% during the past 5 years and 6.02% over the past decade.
While this pace of dividend growth isn’t eye popping, JNJ has grown its dividend for a very long time and kept this steady pace up to boot.
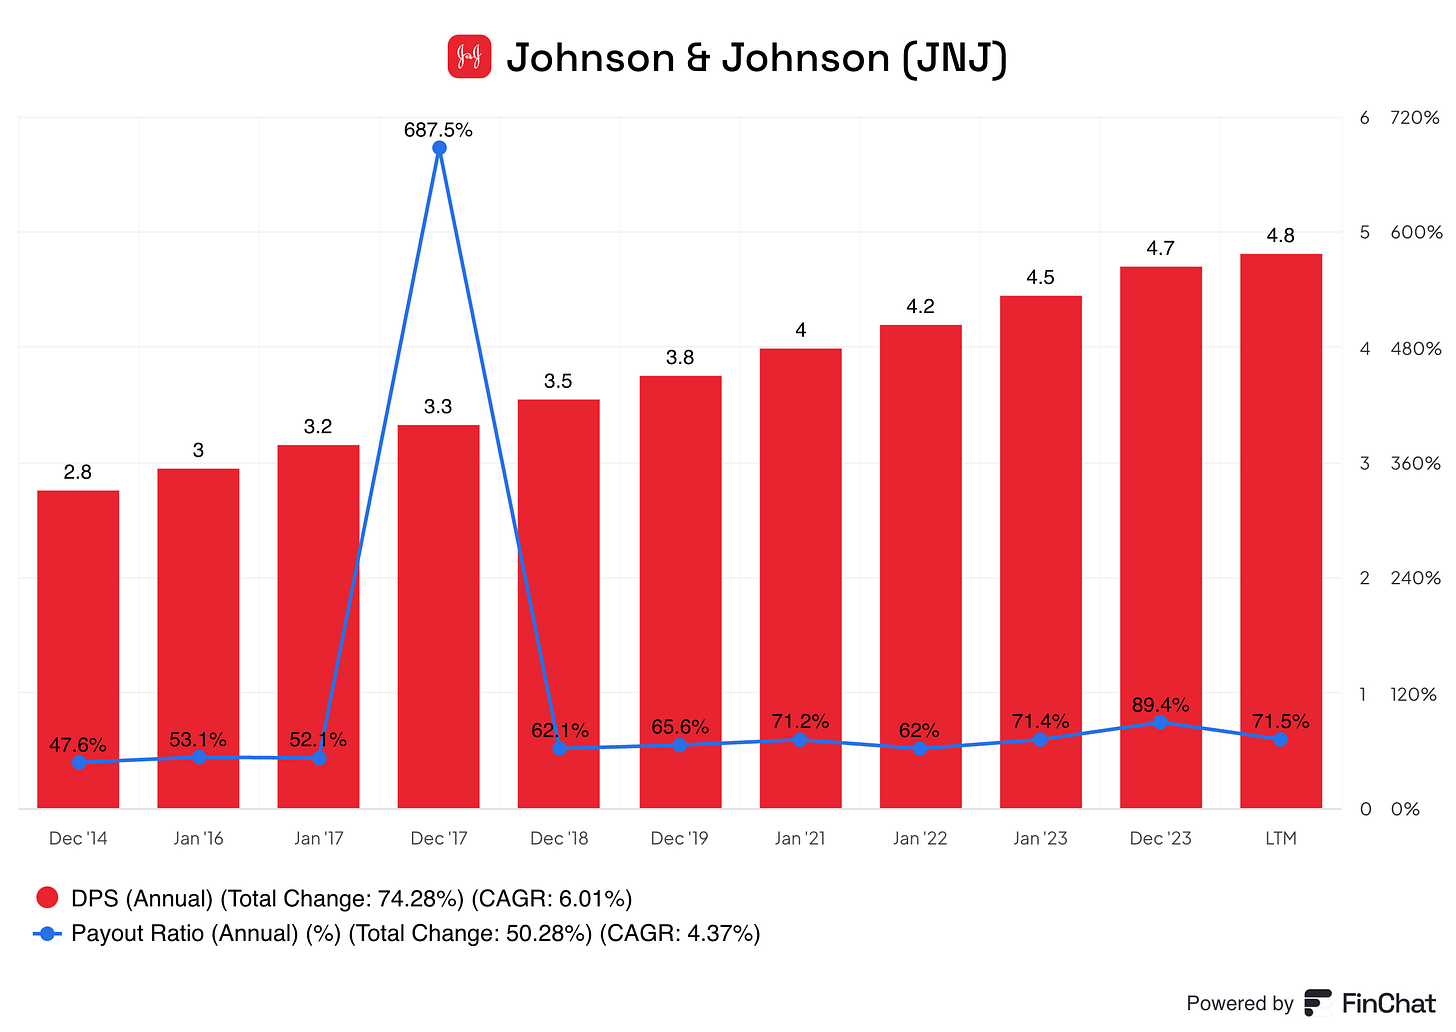
As the chart below shows, JNJ’s payout ratio has crept a little higher during the past decade, currently sitting at 71.5%. While this increasing payout ratio isn’t ideal and may hamper future dividend growth, a 71% payout ratio is still reasonable especially for such a seasoned company.
4. Quality Metrics
In my opinion the three most important metrics that all high quality businesses should have in common are: a growing revenue stream, a strong and steady gross profit margin and a robust return on invested capital.
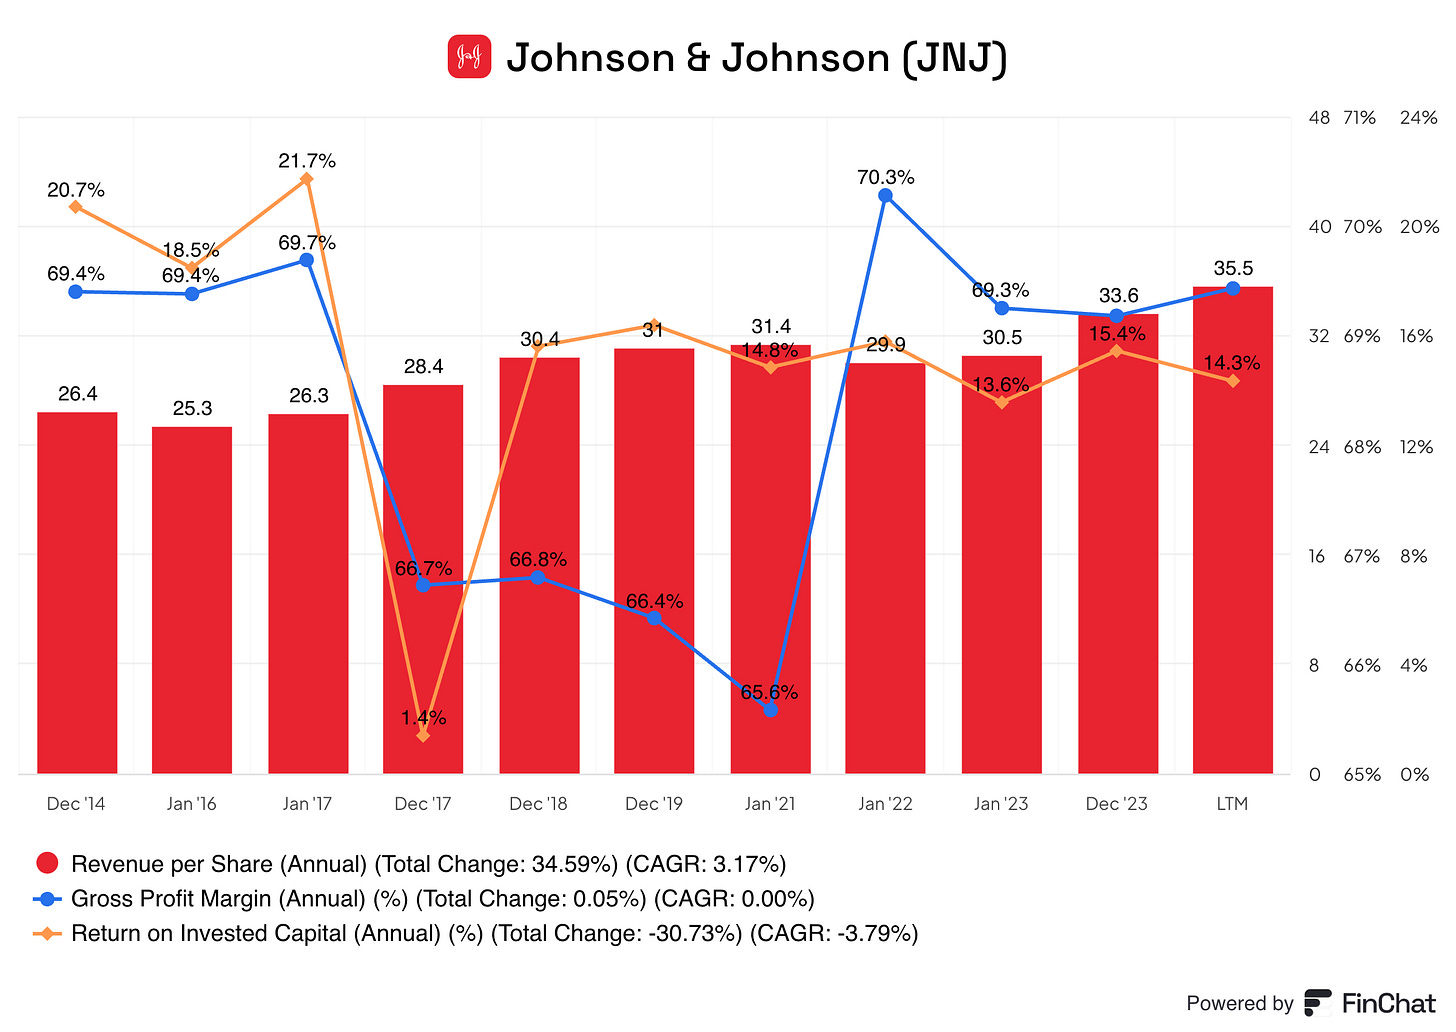
Take a look at the chart below to see how JNJ stacks up.
Revenue growth hasn’t been consistent from year to year but on average it has grown at a rate of 3.17% per year.
The gross profit margin dipped between fiscal 2017 and 2021, but more recently it has returned to a more normal long-term range between 69% and 70%. This is a very good gross profit margin.
The return on invested capital has remained steady, at least since 2018, in the low to mid teens. While I personally like to see a ROIC closer to 20%, a 14% ROIC is still admirable.
5. Valuation
The last consideration is whether JNJ is trading for an attractive price today. As the custom FCF valuation tool below suggest the stock is currently trading for approximately a 10% discount to fair value. We can observe that in 2021 and 2022 the share price climbed above fair multiples, and more recently the free cash flow has caught up with the share price.
JNJ isn’t going to double or triple in value in a short period of time. But if it can get past the ongoing lawsuits without being clipped at the knees, this is a company that can be your Steady Eddie.
JNJ currently has a long-term expected rate of return of 10.53%, this ROR is broken down as follows:
3.08% dividend yield
1.92% return to fair value
5.53% expected earnings growth rate
Overall I think JNJ is a solid business with a proven track record of delivering slightly better than market returns. The recent slump may be a good opportunity to pick up shares for a slight discount but the ongoing lawsuits are certainly a concern that should be considered. Perhaps it would be wise to place JNJ on your watchlist and patiently wait to see how the story develops.


