Intro
While there are many ways to find success in the stock market, I believe there is a singular path to build great wealth in the long term. This path, is to follow these three fundamental rules.
Invest in High-Quality Businesses.
Purchase them for a fair or better price.
Retain these positions as long as the integrity of the first rule endures.
Today I am going to tell you about MSCI (Morgan Stanley Capital International), why I believe it is an outstanding business, currently trading for a reasonable price.
Background
MSCI is a global provider of investment decision support tools, including indices, portfolio risk and performance analytics, and governance tools. They are most well known for their stock market indices like the MSCI World index, that is used by many investors to benchmark the performance of their portfolios. The company started as an internal research firm within Morgan Stanley bank, as the need for indices and benchmarks gained traction in the late 1960’s. The company derives its revenue from five segments of the business.
Index Licensing Fees
Analytics and Risk Management Services
ESG (Environmental, Social, and Governance) Ratings and Research
Custom Solutions and Consulting
Data and Information Services
MSCI possesses a strong competitive position in the financial services industry, supported by its established brand and reputation, extensive global coverage through widely recognized indices, and a history of innovation in product development. The company’s commitment to data quality, accuracy, and regulatory compliance further enhances its standing. MSCI’s proactive approach to adapting to market trends, such as the introduction of ESG ratings and risk management solutions, keeps it at the forefront of meeting evolving investor needs. Strategic partnerships and collaborations contribute to expanding its influence in the financial ecosystem. While MSCI benefits from these competitive advantages, the dynamic nature of the industry necessitates ongoing innovation and vigilance to maintain its market position.
Boasting a substantial market capitalization of $44.7 billion, MSCI secures its position as the 194th largest company within the S&P 500 index. Although its tenure as a publicly traded company is relatively brief, MSCI's history is highlighted by a compelling narrative of robust performance, a story we will delve into next.
Track Record
MSCI made its public debut on November 14, 2007, at $23 per share, a timing that coincided almost eerily with the onset of the Financial Crisis. Despite the unfortunate timing, the company’s initial results were far from lackluster. By the close of November, the stock had climbed to an impressive $27.65, marking a commendable 20% gain. The year finished on a high note, with MSCI reaching an all-time high price of $38.40, a windfall 67% gain for early investors in a mere month and a half.
However, the tide turned less favorably in 2008. The stock, mirrored the broad markets descent, reaching an all-time low price of $11.88 on November 20, 2008. This downturn represented a significant 69% decline from its peak, translating to a near 50% erosion of the initial investment for IPO shareholders in the span of just one year.
Since the Financial Crisis, MSCI has embarked on a truly remarkable trajectory, far eclipsing the performance of the S&P 500. From December 2007 to November 2023, MSCI boasts an impressive compound annual growth rate (CAGR) of 20.90%, in contrast to the S&P 500’s 9.34%. This translates into an investment in MSCI doubling more than twice as swiftly as its counterpart in the S&P 500.
To clarify this financial journey in tangible terms, envision a $10,000 investment in MSCI, which would have grown into an astounding $208,411. An equivalent investment in the S&P 500 would have yielded a mere modest $41,708.
Examining MSCI’s monthly returns against those of the S&P, the stock has shown superior performance 57.29% of the time, as measured by calendar month returns. Notably, investors who exercised patience and retained their shares for longer durations saw even more favorable outcomes. Over a rolling 12-month period, MSCI outperformed the index 66.85% of the time. This outperformance continued to strengthen over a rolling 36-month horizon, reaching 77.71%. Moreover, on a rolling 60-month basis, the margin of outperformance saw a slight uptick to 78.20%.
While a track record of impressive returns is certainly noteworthy, the question that beckons is what lies ahed on the horizon for MSCI.
Quality Quadrant
Let’s start by evaluating how attractive MSCI looks through the lens of business quality. I believe a great place to start evaluating the quality of a business is what I like to call the quality quadrant. This quadrant comprises four key financial metrics that serve as reliable indicators for gauging the operational strength of a business. These metrics are the return on capital employed, total revenue, gross margin and the free cash flow conversion ratio.
The return on capital employed tells me how profitable a company is and how well it has utilized its capital. Effectively turning capital into profits is the primary driver of generating shareholder value.
Over the last decade, MSCI has consistently improved its Return on Capital Employed (ROCE), reaching an impressive rate of 36.13% in the trailing twelve months. Notably, from 2013 to 2016, the ROCE remained below 20%, but it has improved beyond this threshold in subsequent years. Both the short-term (3-year) and long-term (10-year) growth trends reflect a commendable 9% trajectory. In sum, MSCI earns a noteworthy 93% quality rating for its historical ROCE, indicating a robust performance in utilizing capital for profitable returns.
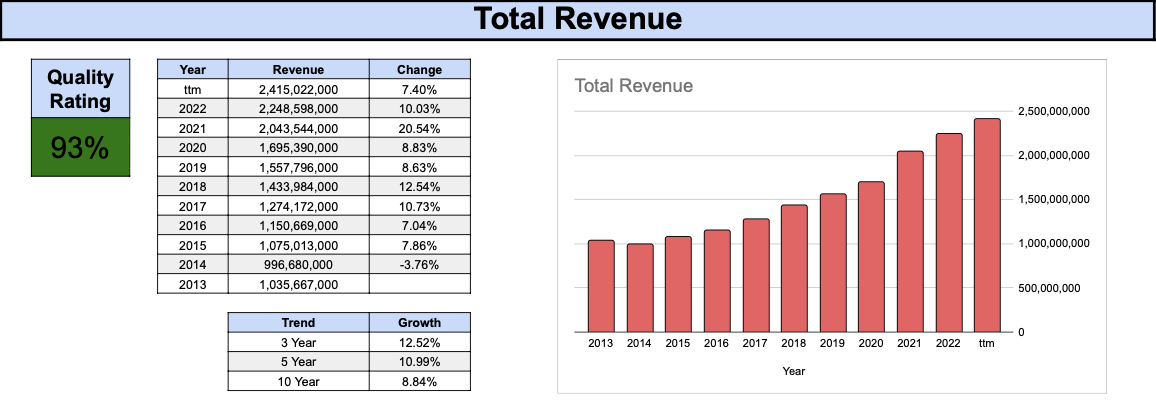
Revenue represents the financial inflow generated by a business through its operations. Positioned at the forefront of the income statement as the top-line figure, revenue provides a key indicator for assessing the pace of a business’s growth when analyzed across historical values.
Over the last decade, MSCI has grown its revenue by a remarkable 133%, equivalent to an annualized growth rate of about 8.64%, a commendable pace by any standard. Aside from a singular instance in 2014, when year-over-year revenue experienced a decline, MSCI has consistently recorded sustained growth in total revenue. In sum, the company earns a notable quality rating of 93% for its robust revenue history.
Gross margin is the portion of revenue that is left over after direct costs are subtracted. It is one of the most important indicators of a company’s financial performance. This metric shows the cash available for various crucial purposes, including sustaining operations, servicing debt, distributing to shareholders, and fueling future growth.
Over the last decade, MSCI has consistently maintained a robust and upward-trending gross margin. Starting at a low of 68% in 2013, it has climbed steadily to exceed 83% today. This substantial gross margin not only showcases the company’s financial strength but also provides a considerable degree of flexibility. Given the consistently high margin and its positive trajectory over the past decade, MSCI earns a flawless quality rating of 100% in this category.
The free cash flow conversion ratio is a measure of a company’s capability in transforming profits into free cash flow. In straightforward terms, free cash flow reigns supreme, and companies adept at generating robust levels of free cash flow enjoy greater financial flexibility.
Over the last decade, MSCI has shown strong proficiency in converting profits into free cash flow. While a bit more year-to-year consistency would be ideal, the free cash flow conversion ratio has predominantly held above the 60% mark. Notably, there has been a recent uptick, with the ratio consistently surpassing 80%, barring a slight exception in the trailing twelve months. Given the fluctuations and a recent dip, MSCI still earns a solid quality rating of 88% in this category.
By combining the quality ratings for all four metrics, MSCI earns an impressive composite quality score of 93.5%. In my opinion, any company boasting a score surpassing 90% resides in the highest tier of business quality. While there are many aspects that need to be considered in sound due diligence, screening for the quality quadrant is an excellent starting point. I leave the rest up to you.
Dividend History
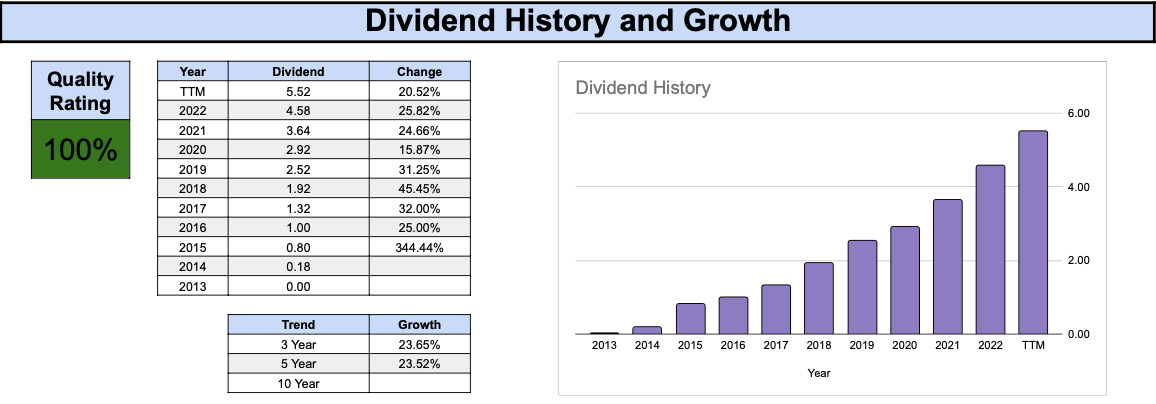
MSCI paid its first dividend seven years after its IPO. Presently, it boasts a relatively short but remarkably strong track record of dividend growth, spanning an impressive nine-year period.
While MSCI’s dividend yield has never reached notable heights, hitting a peak of 1.42% in 2018, its long term dividend CAGR has consistently exceeded 20%, both in the short and long term.
In 2020, investors witnessed the company’s smallest year-over-year dividend increase at 15.87%. Notwithstanding this, the still impressive dividend boost maintained a trend of annual increases exceeding 20% or even 30% for the past nine years. Although the current above-average rate of dividend growth is appealing, it’s reasonable to expect this growth rate to cool off over the next decade.
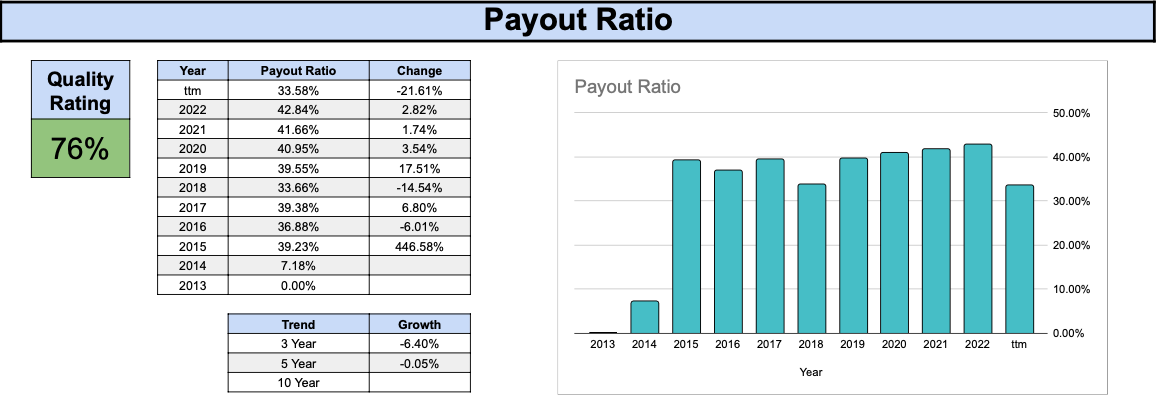
Despite a history of high dividend growth, MSCI has defied the trend of a rising payout ratio over time. Throughout the last decade, the company has maintained its payout ratio within a healthy range, hovering around 40%. This level of payout ratio not only provides ample room for future dividend growth but also leaves a surplus of cash on hand, ready to be strategically reinvested back into the business.
Valuation
Valuation, though more art than science, requires us to establish a baseline for fair value. To help me with this task, I leverage two techniques to evaluate the attractiveness of a particular stock: dividend yield theory and the price-to-earnings multiple valuation.
Let’s take a look at dividend yield theory first.
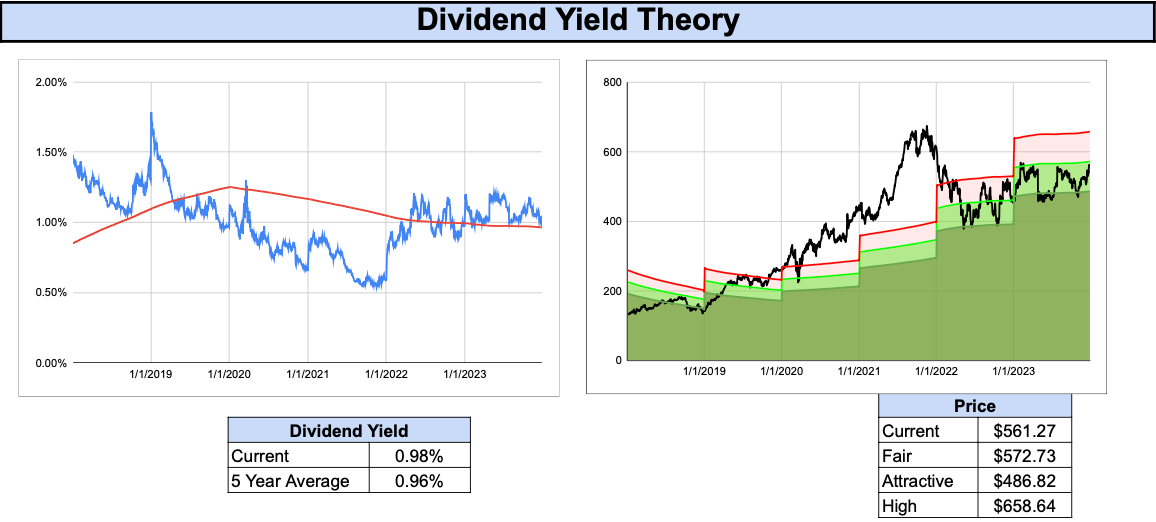
This valuation method operates on a simple principle: if the current dividend yield exceeds the trailing average dividend yield, the stock is deemed undervalued, and conversely, overvalued if the inverse is true. In the chart on the left, MSCI’s historical dividend yield (blue line) is juxtaposed with its 5-year rolling average dividend yield (red line). The dividend yield has mainly oscillated within the 0.5% to 1.5% range, with a general trend around 1%. An outlier in early 2019 caused a spike above 1.5%. It’s worth noting that the chart reflects the forward dividend yield, accounting for the discrepancy with the previously mentioned peak of 1.42% based on the trailing dividend yield.
The 5-year trailing average dividend yield presently stands at 0.96%, indicating that when the actual yield surpasses 1%, MSCI begins to look attractive. According to dividend yield theory, a fair price for MSCI today is in the range of $573.
Now let’s see what the price to earnings multiple can tell us.
Over the past 7 years, MSCI’s P/E ratio has trended higher, reaching a peak just shy of 80 in late 2021. In the chart on the right, this period indicated a phase where the company appeared significantly overvalued. Driven by its high long-term growth rates, MSCI has demanded a premium valuation from the market. The historical trailing average P/E ratio has climbed from approximately 25 in 2018 to around 45 today. While this may seem relatively high in the broader market context, it aligns with the expectations for an outstanding business growing at a very rapid pace.
Currently, with a P/E ratio of 46.58 slightly surpassing the trailing average, it suggests that MSCI is marginally overvalued. A straightforward calculation based on the historical P/E multiple points to a fair price of around $547 today.
Combining both valuation methodologies, we arrive at an average fair price for MSCI of $560, very close to the current market price of $561,27 as of market close on Wednesday, December 27, 2023. Although this valuation leaves little margin of safety, I would assess MSCI as reasonably valued today.
Final Thoughts
I currently hold a long position in MSCI, with intentions of holding on to my shares for as long as I find it to be a high quality company. I strongly recommend conducting your own in-depth due diligence beyond the brief analysis I shared with you today. This way, you can assess whether you share my belief in MSCI as a high quality business and whether the current valuation aligns with your own investment criteria.


I’m really enjoying this new newsletter. Thanks for all your hard work! Happy new year.