


How Do You Forecast The Future Rate of Return For A Stock
And a test of how well my process has worked historically.
Forecasting A Future Rate of Return
We would all love to predict the future rate of return for any given stock with a high level of precision. This, of course, would lead to spectacular investment returns. While we all practice some form of market forecasting, at the end of the day, we are simply making an educated guess.
You could approach this problem in several ways. A technical approach might involve identifying areas of support and resistance to anticipate where a security's price may move in the near future. A more fundamental approach might involve projecting a company's earnings per share (EPS) for the upcoming year and multiplying that figure by a fair price-to-earnings (P/E) ratio. Both methods would yield a “target price” from which you could estimate the future rate of return.
Of course, we all know that the stock market isn’t always efficient, and investors aren’t always rational. Therefore, just because your short-term target price makes conceptual sense, market sentiment may not always align in your favor.
I believe it’s more practical to forecast long-term future rates of return because, in the short term, the stock market acts as a voting machine, while in the long term, it functions as a weighing machine. This explains why stock prices are driven by market sentiment in the short term but tend to align more closely with fundamentals over time.
My Formula
My method for estimating a future rate of return is quite simple. Since forecasting is essentially an educated guess, I believe it is unnecessary to overcomplicate the formula. I use the following three parameters:
Forward Dividend Yield
3-5 Year EPS Forecast
Fair Multiple
Forward Dividend Yield
This is the simplest of the three inputs because it does not require assumptions. The current dividend rate for any stock is publicly available, and calculating the forward dividend yield is straightforward—it is simply the current dividend rate divided by the current share price.
The only assumption here is that the company will not reduce its dividend rate in the future.
3-5 Year EPS forecast
The easiest way to find a 3-5 year EPS forecast is by checking financial websites that aggregate analyst projections. I prefer to use Finviz.com because it allows me to access this metric for multiple stocks easily through its free stock screener. You can find the forecast under the “Valuation” tab, labeled as “EPS Next 5”.
The assumption here is that the analysts providing these forecasts are experts in the given company, industry, and sector. However, studies have shown that EPS forecasts are not always highly accurate. Analysts tend to be conservative when projecting high-growth companies and overly optimistic when evaluating slower-growth companies.
To add a margin of safety, you could apply a discount to EPS forecasts—reducing them by a set percentage. This way, your estimated future rate of return will be more conservative, and if you are wrong, the upside potential is higher than expected.
Fair Multiple
There are several ways to determine a fair multiple:
Price-to-Earnings (P/E) Ratio
Price-to-Free Cash Flow Ratio
Dividend Yield Theory (for dividend growth stocks)
I have used all three but currently favor the Price-to-Free Cash Flow Ratio or its inverse, Free Cash Flow Yield. You can examine a stock’s long-term historical data to determine an appropriate fair multiple, but it's important to consider overall market sentiment. Long-term fair multiples can fluctuate depending on whether we are in a bull or bear market.
I personally use a 5-year rolling average Free Cash Flow multiple to assess a stock’s fair price. I analyze 12 years of historical data and calculate a rolling 5-year average over a seven-year period.
Putting It All Together
The formula for estimating the future rate of return is:
Future ROR = Forward Dividend Yield + (3-5 Year EPS Forecast×Margin of Safety) + Potential Return to Fair Value (Annualized over 5 years)
Example: Mastercard
Forward Dividend Yield: 0.57%
3-5 Year EPS Forecast: 14.31%
Undervaluation: 3%
Future ROR = 0.57% + 14.31% + 0.59% = 15.48%
The 15.48% estimated long-term rate of return for Mastercard does not include any margin of safety for the EPS forecast.
If we were to apply a 25% Margin of Safety (MoS) to the EPS forecast, the ROR would be 11.90%.
Interpreting The Rate of Return
Do I actually believe Mastercard will deliver a 15.48% or 11.9% return over the next 3-5 years? No.
I use these return estimates to compare different investment opportunities. For example, at present, Mastercard appears more attractive than Apple, which has an estimated return of 5.17%. My estimates are meant to represent potential upside rather than precise predictions.
How Well Does It Actually Work
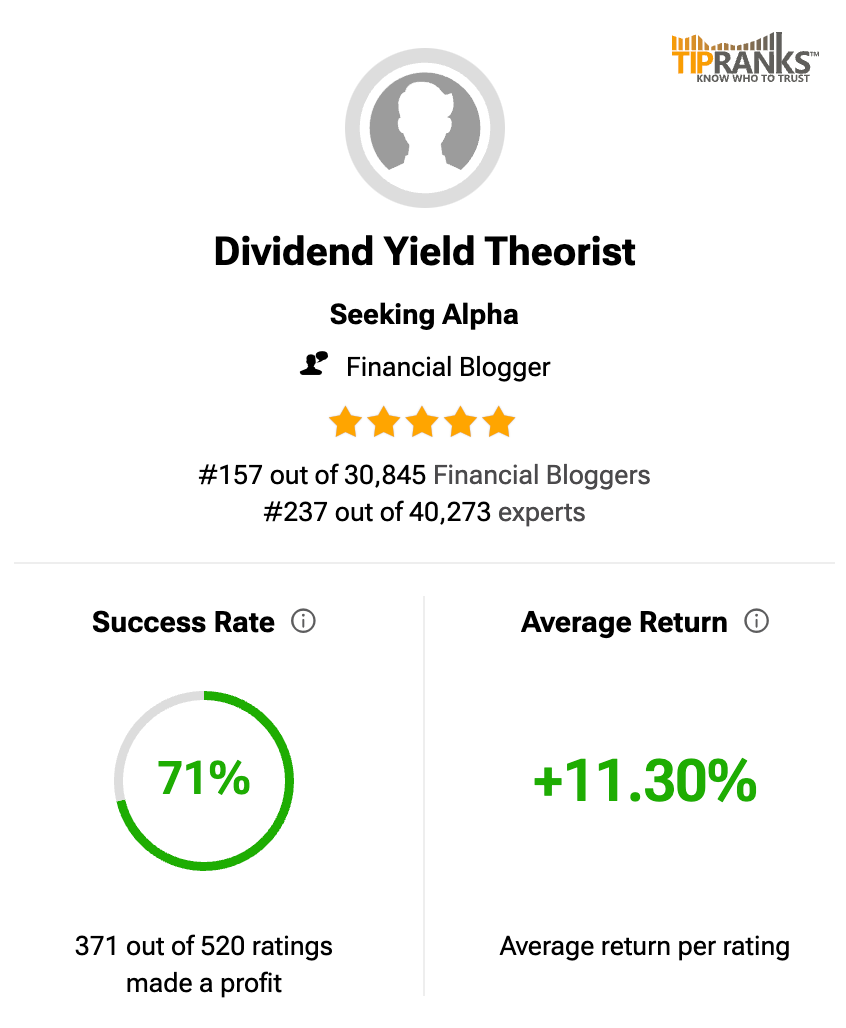
If you have followed me for a while, you might know that I contribute to SeekingAlpha.com under the name The Dividend Yield Theorist.
Interestingly, according to TipRanks, I am currently ranked #157 out of 30,000+ Financial Bloggers and #237 out of over 40,000 experts—not too bad!
Since November 2020, I have documented a Top 10 High-Yield Dividend Stock Watchlist on Seeking Alpha. In September 2021, I introduced an estimated rate of return into the stock selection process, based on the concepts discussed in this post (with the exception of using Dividend Yield Theory instead of Free Cash Flow to determine fair multiples).
Observations from My Analysis
I analyzed forecasted rates of return from September to December 2021 and compared them to actual returns. The data showed that my return estimates were not perfectly precise. However, the stocks I selected consistently outperformed those I did not.
For example:
September 2021: Selected stocks had a forecasted return of 15.85% but an actual return of 11.66% (annualized).
October 2021: Selected stocks had a forecasted return of 17.13% but an actual return of 14.57%.
November 2021: Selected stocks had a forecasted return of 16.13% but an actual return of 11.66%.
December 2021: Selected stocks had a forecasted return of 17.20% but an actual return of 10.48%.
Conversely this is how the Not selected stocks performed:
September 2021: Not selected stocks (13) had a forecasted return of 7.38% but an actual return of 5.64% (annualized).
October 2021: Not selected stocks (20) had a forecasted return of 6.56% but an actual return of 5.83%.
November 2021: Not selected stocks (18) had a forecasted return of 5.82% but an actual return of 5.21%.
December 2021: Not selected stocks (21) had a forecasted return of 7.80% but an actual return of 4.99%.
While the estimates were not exact, they successfully identified more winners than losers, making them useful for investment decision-making.
That said, the sample size is still relatively small, and the actual returns fall within the early stages of the 3-5 year estimate window. It will be interesting to see if this correlation holds as more data becomes available.
Takeaway
I share my estimated rates of return in individual stock analyses within this newsletter, as well as for the investable universe available to paid members. You are welcome to use these estimates however you see fit, but I hope this explanation clarifies how I personally apply them.
This calculation is meant annually right?