


Quality Dividend Stock Snapshots: TSMC, Intuit, Qualcomm, UnitedHealth Group and Pepsico
A quick stock analysis to help you identify potential opportunities to explore further.
Financial Snapshots
Here’s a quick financial snapshot of 5 stocks I recently looked at in my Quality Score tool. I use these snapshots to determine whether a given company looks attractive and warrants a deeper dive. While I don’t always move forward with a deeper review for all the stocks I look at, perhaps some of them may spark interest in your eyes.
You’ll notice that I have added 2 new metrics to my quality analysis; Liquidity and Share Dilution.
Let’s dive into the financial snapshots, if you’d like to see more detail for any of these stocks I have attached PDFs at the bottom that include a historical chart for each financial metric.
1. TSMC TSM 0.00%↑

Positives
Strong Revenue Growth
Superb Free Cash Flow Growth
High and expanding Gross Profit Margin
Healthy and growing Return On Invested Capital
Very high Liquidity
An attractive and low Payout Ratio
Negatives
Mixed track record of Dividend Growth
No Buyback history but also no Share Dilution

Very strong historical Rate of Return
Potentially Undervalued based on Free Cash Flow Model
Potentially High Forward Rate of Return Assumption
2. Intuit INTU 0.00%↑
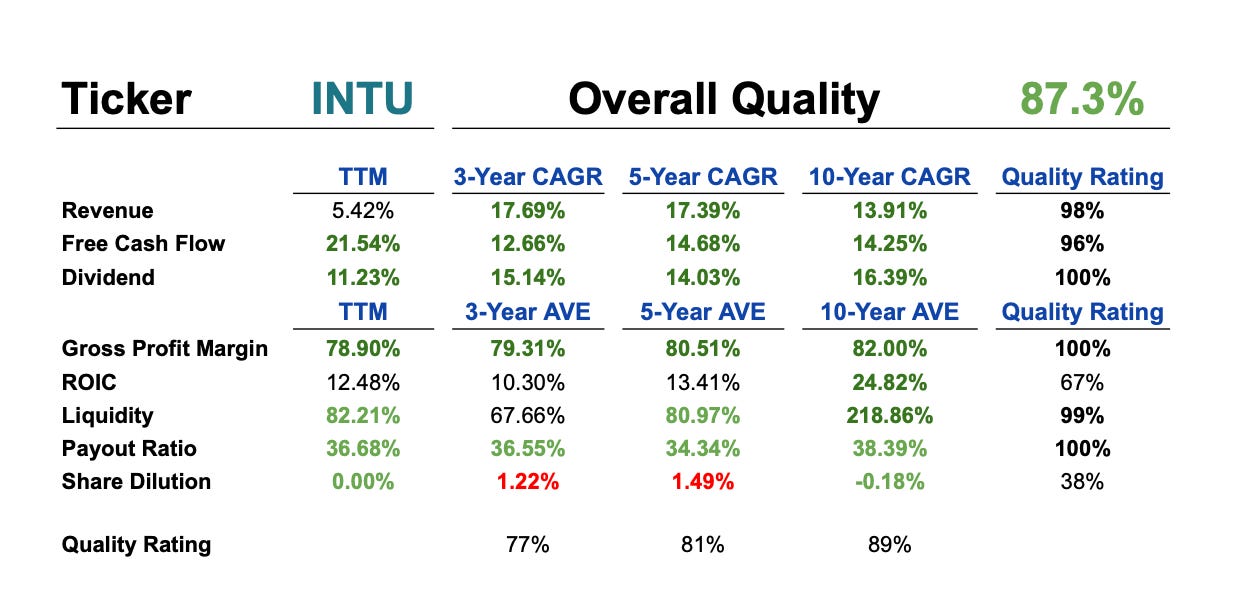
Positives
Strong Revenue Growth
Very good Free Cash Flow Growth
Very high but marginally declining Gross Profit Margin
Very attractive pace of Dividend Growth
High Liquidity that has declined during the past decade
An attractive and low Payout Ratio
Negatives
Decent but declining Return On Invested Capital
Marginal Share Dilution
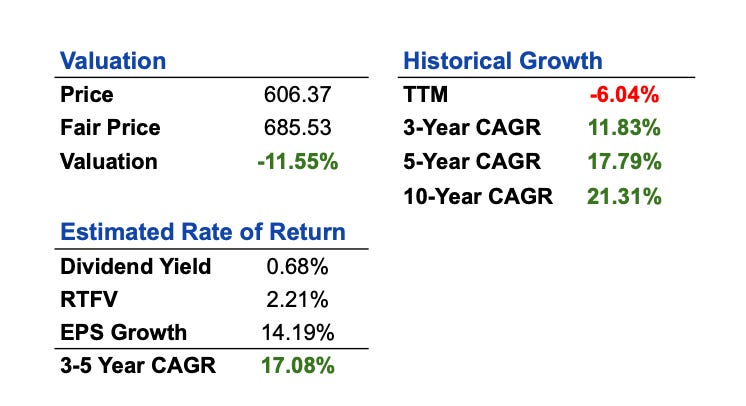
A strong but slowing historical Rate of Return with a poor TTM
Potentially Undervalued based on Free Cash Flow Model
An attractive potential Forward Rate of Return Assumption
3. Qualcomm QCOM 0.00%↑
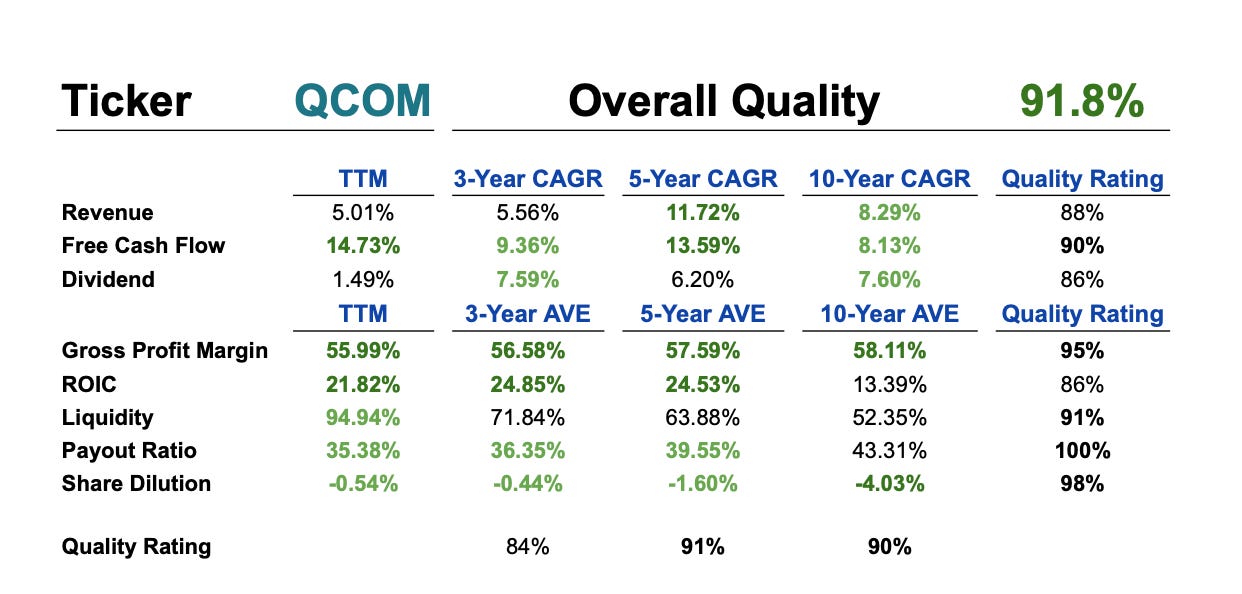
Positives
A good track record of Free Cash Flow Growth
A high and steady Gross Profit Margin
A strong and growing Return On Invested Capital
An average pace of Dividend Growth
Strong and improving Liquidity
An attractive and declining Payout Ratio
A nice track record of Share Buybacks
Negatives
Decent but slowing history of Revenue Growth
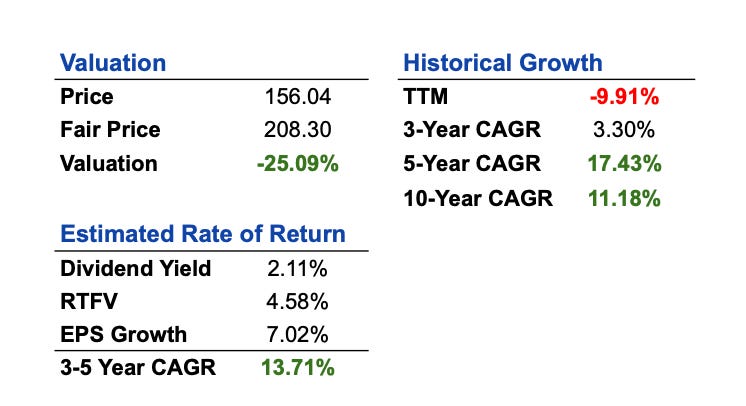
A good long-term historical Rate of Return with a poor past few years
Potentially Undervalued based on Free Cash Flow Model
An respectable potential Forward Rate of Return Assumption
4. UnitedHealth Group UNH 0.00%↑

Positives
A strong track record of Revenue Growth
A decent and steady Gross Profit Margin
An excellent history of Dividend Growth but one that is slowing
A steady history of Liquidity
An attractive and declining Payout Ratio but one that is creeping higher
A nice track record of Share Buybacks
Negatives
A slowing history of Free Cash Flow Growth
A decent but low Return On Invested Capital

A good long-term historical Rate of Return but the stock has underperformed in the past few years
Potentially Overvalued based on Free Cash Flow Model
A just below attractive (10%) Forward Rate of Return Assumption, despite the overvaluation
5. Pepsico PEP 0.00%↑

Positives
A reasonable track record of Revenue Growth that has stagnated recently (see full PDF)
A high and steady Gross Profit Margin
An good track record of Dividend Growth that is holding steady
A steady but somewhat high Payout Ratio
A nice track record of Share Buybacks
Negatives
A rather poor history of Free Cash Flow Growth
A decent but low Return On Invested Capital
A steady but low history of Liquidity

A below average long-term historical Rate of Return
Potentially Undervalued based on Free Cash Flow Model
A just below attractive (10%) Forward Rate of Return Assumption, even with the potential undervaluation
What Do You Want To See
Let me know if there is a stock you are currently considering that you would like to see a financial snapshot for and I may include it in the next edition.
Full Analysis PDFs