


3 DGR Portfolio - Year 1 Performance Review
What Worked, What Didn’t, and What I Learned
📈 Final Results
Let’s start with the bottom line — Year 1 performance.
Total Return: +5.28%
Starting Value: $8,024.82
Ending Value: $8,448.47
Breakdown:
Dividends Received: $146.37
Capital Appreciation: $277.28
Dividend Return: 1.82%
Capital Return: 3.46%
For comparison, the S&P 500 returned +12.10% over the same period, meaning this portfolio underperformed by 6.82%.
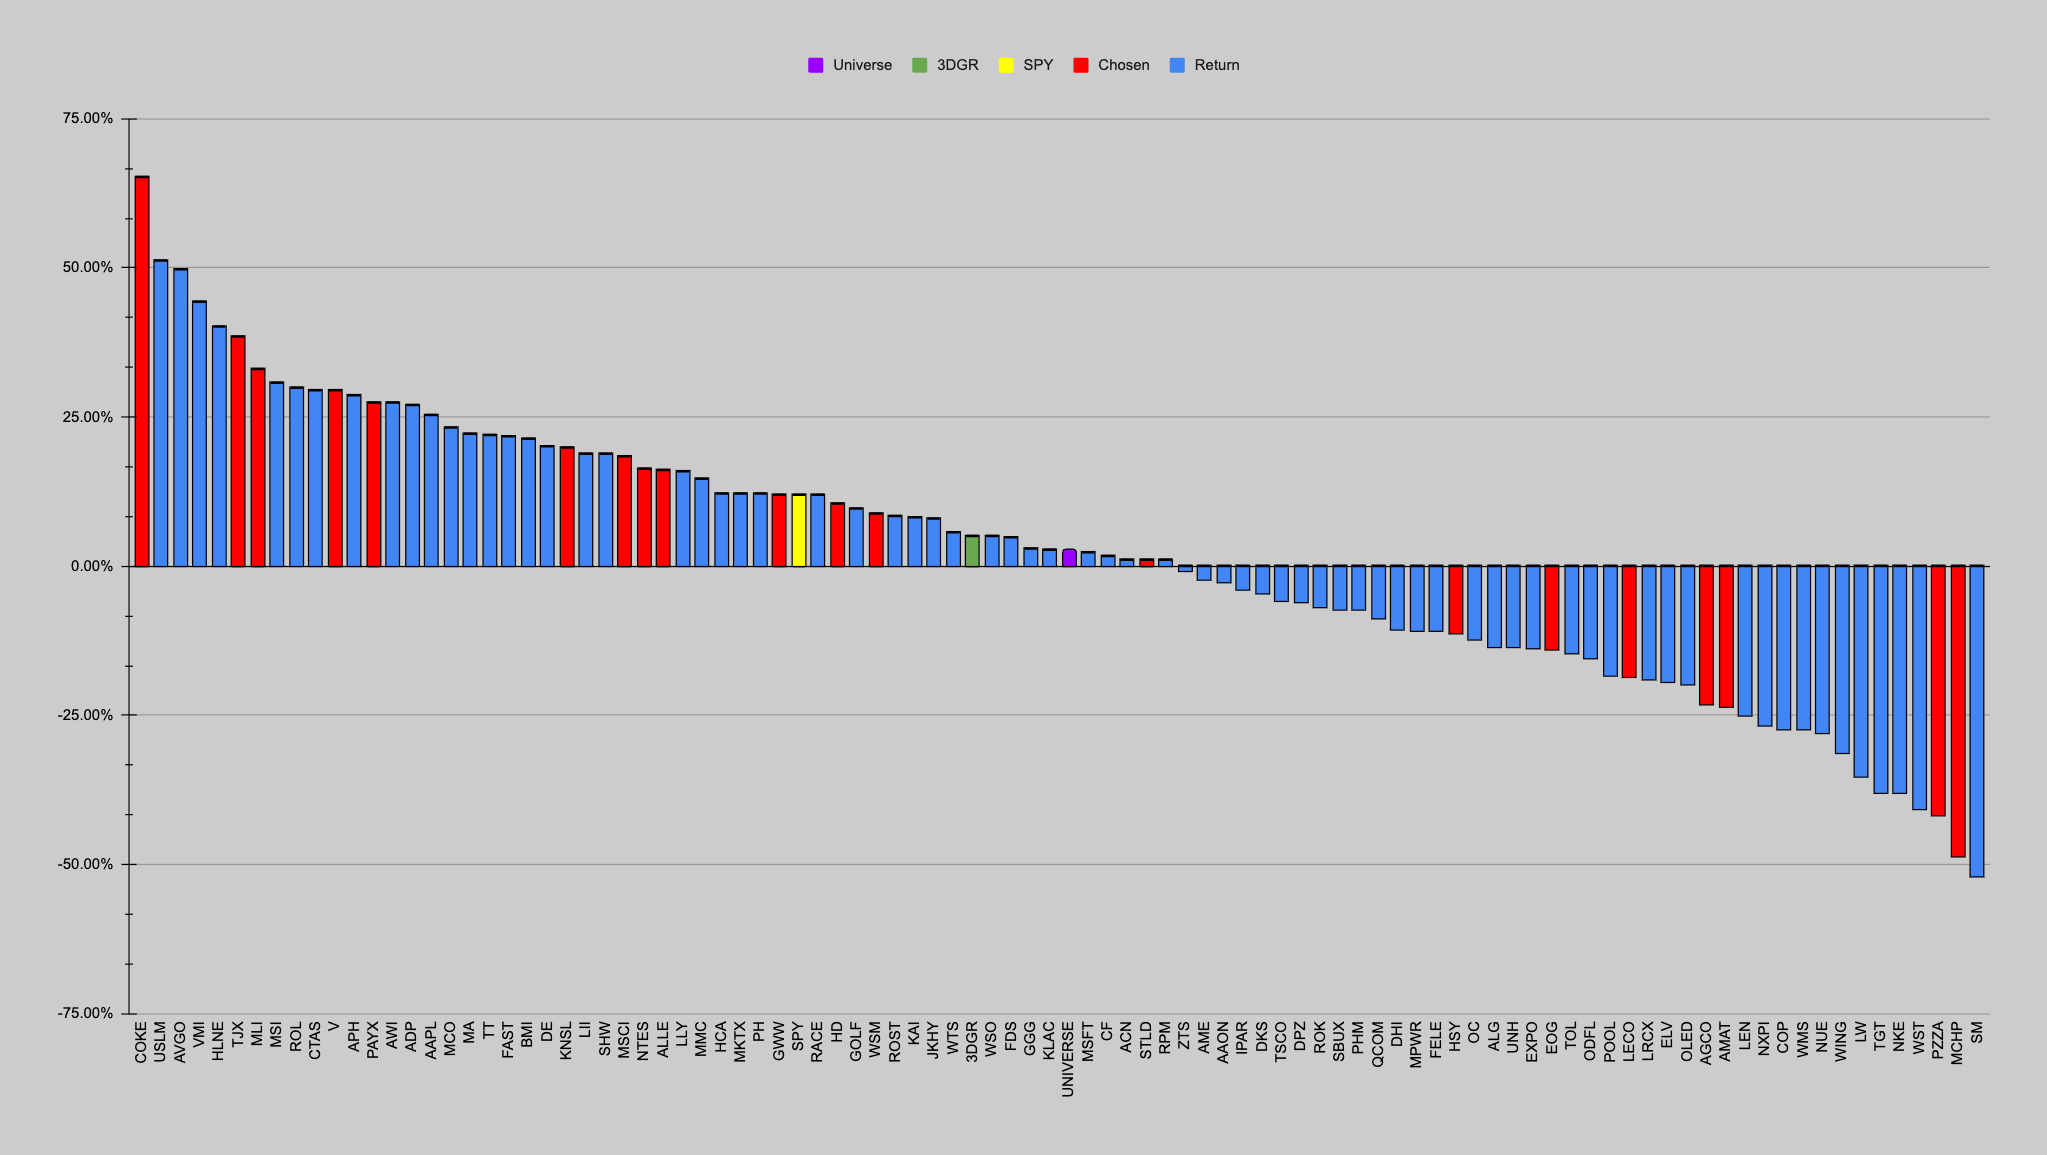
🏆 Winners and Losers
Of the 20 selected stocks:
13 had positive returns
7 ended in the red
Top Performers:
COKE: +65.15%
TJX: +38.58%
MLI: +33.01%
V: +29.58%
PAYX: +27.48%
KNSL: +19.92%
MSCI: +18.42%
NTES: +16.36%
ALLE: +16.24%
GWW: +12.06%
HD: +10.58%
WSM: +8.87%
STLD: +1.20%
Biggest Laggards:
HSY: -11.14%
EOG: -13.96%
LECO: -18.49%
AGCO: -23.12%
AMAT: -23.47%
PZZA: -41.73%
MCHP: -48.64%
🔍 Relative Performance
The average return of the broader investable universe was +2.81%, which means:
The strategy outperformed the universe by a respectable margin.
But both the portfolio and its universe significantly underperformed the S&P 500.
That context matters.
💡 What I Learned
While the portfolio didn’t beat the S&P 500, it did beat the broader universe it was built from. That suggests the stock selection process added value, even in a tough environment for many of these names.
But there were gaps:
Valuation and growth potential weren’t adequately factored in.
These are addressed more thoughtfully in the Year 2 update (linked below).
Yes — I could have just invested in the S&P 500 and earned more. But that would’ve taught me less. This portfolio gave me the opportunity to test, learn, and optimize — and that’s invaluable moving forward.
🔁 Year 2: Redemption in Progress
The updated portfolio for Year 2 has only been live for 7 trading days, but it’s already off to a stronger start.
Portfolio Value (as of May 9): $8,890.93
Gain: $442.46 — nearly $19 more than Year 1’s full-year gain
YTD Return: +5.24%
S&P 500 YTD: +1.66%
That’s encouraging, but we’re early in the game.
The revised portfolio isn’t expected to deliver dividend growth this year due to its reconstitution. Its forward yield is 1.13%, with projected dividend income of $100.69.
This reflects a shift in focus — while dividends matter, total return remains the primary objective.
🧮 Since Inception
Cumulative Portfolio Return: +10.79%
S&P 500 Return: +12.10%
Current Underperformance: -1.31%
We’ve closed much of the Year 1 gap. Whether we fully catch up — time will tell.
🧭 Looking Ahead
I may share occasional updates, but I don’t plan to micromanage the portfolio. Watching it daily won’t make it perform any better. The real insights will come with time — so I’ll revisit it meaningfully around April 2026.
Thanks for following along.